
 - Blog
| Conference: | Amer |
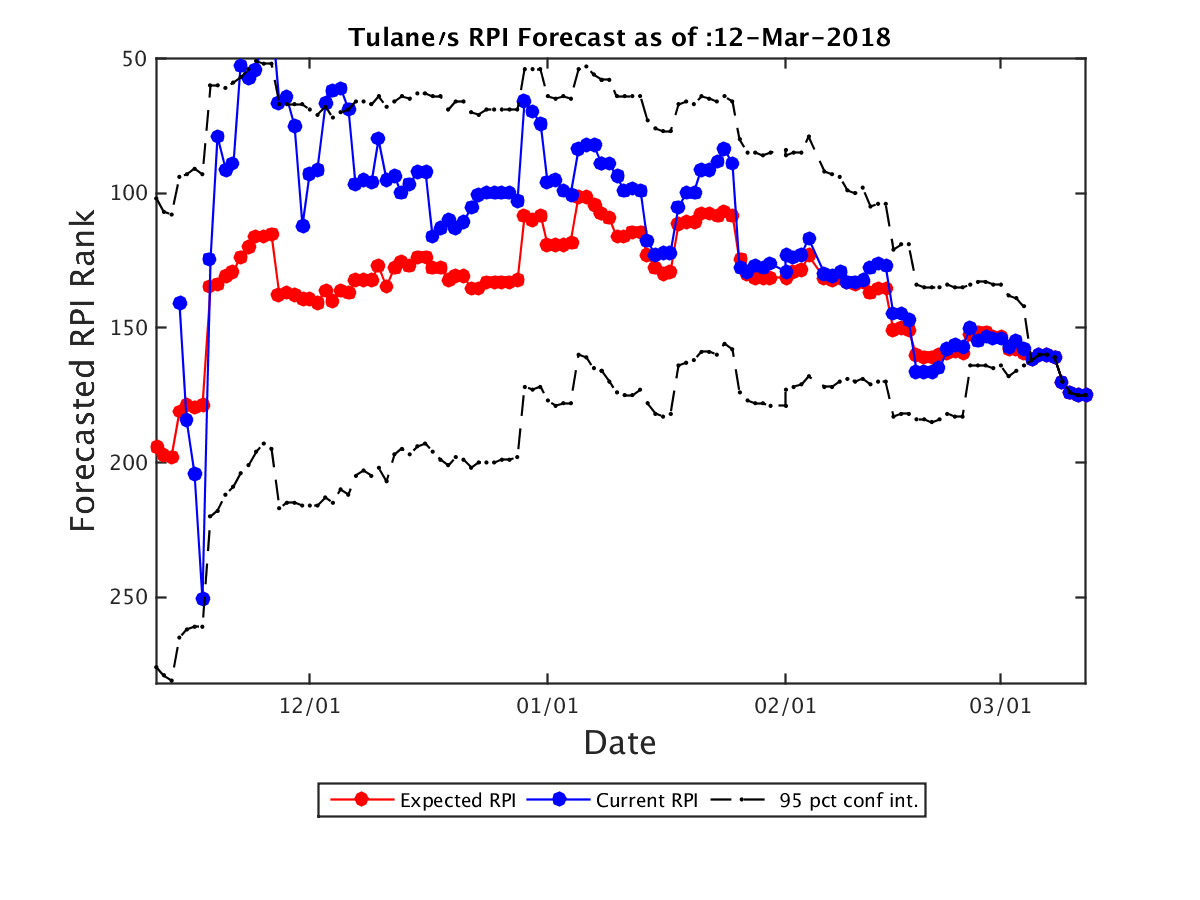
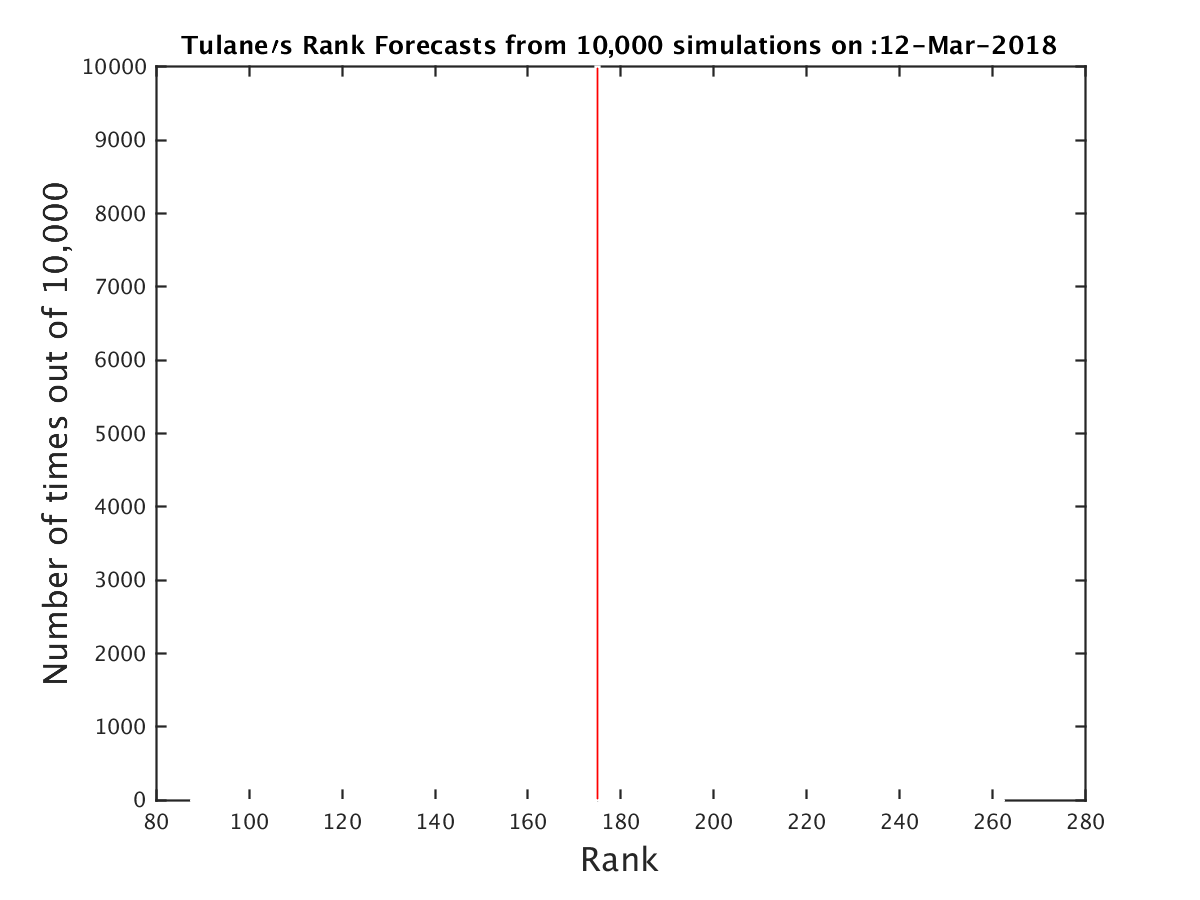
| Expected RPI: | 175.0 |
| Current RPI: | 175 |
| Expected SOS: | 97 |
| Current SOS: | 97 |
| Current Record: | 14-17 |
| Expected Record: | 14-17 |
| Current Conf Record: | 5-14 |
| Expected Conf Record: | 5-14 |
| Expected Record vs RPI 1-25: | 1-4 |
| Expected Record vs RPI 26-50: | 0-0 |
| Expected Record vs RPI 51-100: | 1-6 |
| Expected Record vs RPI 101-200: | 4-5 |
| Expected Record vs RPI 200+: | 8-2 |
| Current OOC Record: | 9-3 |
| Expected OOC Record: | 9-3 |
| Expected OOC RPI: | 77 |
| Expected OOC SOS: | 185 |
| Final Record | Expected RPI | Probability |
|---|---|---|
| 14-17 | 175.0 | 100.00% |
| Date | Opponent (Expected RPI) | Conf | Location | Score | Outcome | Prob(W) | Spread |
|---|---|---|---|---|---|---|---|
| 11-10 | LIU Brooklyn (232.0) | NEC | H | 102-96 | W | 100% | 0.0 |
| 11-13 | Southeastern Louisiana (150.0) | Slnd | H | 89-66 | W | 100% | 0.0 |
| 11-17 | Colorado St. (234.0) | MWC | N | 80-53 | W | 100% | 0.0 |
| 11-19 | Fordham (290.0) | A10 | N | 55-63 | W | 100% | 0.0 |
| 11-22 | Miami OH (159.0) | MAC | H | 80-59 | W | 100% | 0.0 |
| 11-26 | Georgia St. (120.0) | SB | A | 70-59 | L | 0% | 0.0 |
| 11-29 | Alcorn St. (348.0) | SWAC | H | 81-65 | W | 100% | 0.0 |
| 12-3 | North Carolina (4.0) | ACC | A | 97-73 | L | 0% | 0.0 |
| 12-6 | Southern (315.0) | SWAC | H | 95-76 | W | 100% | 0.0 |
| 12-10 | Florida St. (54.0) | ACC | N | 72-53 | L | 0% | 0.0 |
| 12-18 | Nicholls St. (145.0) | Slnd | H | 76-69 | W | 100% | 0.0 |
| 12-21 | South Alabama (270.0) | SB | H | 77-73 | W | 100% | 0.0 |
| 12-28 | Temple (52.0) | Amer | A | 75-85 | W | 100% | 0.0 |
| 12-31 | Tulsa (89.0) | Amer | H | 56-65 | L | 0% | 0.0 |
| 1-4 | SMU (113.0) | Amer | H | 73-70 | W | 100% | 0.0 |
| 1-9 | Memphis (106.0) | Amer | A | 96-89 | L | 0% | 0.0 |
| 1-13 | Connecticut (123.0) | Amer | H | 57-67 | L | 0% | 0.0 |
| 1-17 | Houston (18.0) | Amer | H | 81-72 | W | 100% | 0.0 |
| 1-20 | SMU (113.0) | Amer | A | 73-62 | L | 0% | 0.0 |
| 1-25 | South Florida (278.0) | Amer | H | 75-80 | L | 0% | 0.0 |
| 1-31 | East Carolina (274.0) | Amer | A | 69-71 | W | 100% | 0.0 |
| 2-4 | Temple (52.0) | Amer | H | 76-83 | L | 0% | 0.0 |
| 2-8 | Tulsa (89.0) | Amer | A | 91-89 | L | 0% | 0.0 |
| 2-11 | Houston (18.0) | Amer | A | 73-42 | L | 0% | 0.0 |
| 2-14 | East Carolina (274.0) | Amer | H | 80-82 | L | 0% | 0.0 |
| 2-17 | Memphis (106.0) | Amer | H | 63-68 | L | 0% | 0.0 |
| 2-21 | Wichita St. (16.0) | Amer | A | 93-86 | L | 0% | 0.0 |
| 2-24 | South Florida (278.0) | Amer | A | 68-79 | W | 100% | 0.0 |
| 3-1 | Cincinnati (6.0) | Amer | H | 49-78 | L | 0% | 0.0 |
| 3-4 | UCF (84.0) | Amer | A | 60-51 | L | 0% | 0.0 |
| 3-8 | Temple (52.0) | Amer | N | 82-77 | L | 0% | 0.0 |
| Team | Conf | Curr Wgt | Fut Wgt | Curr W/L | Exp W/L | Curr Impact | Exp Impact |
|---|---|---|---|---|---|---|---|
| Tulane | Amer | 26.24 | 26.24 | 41.13 | 41.13 | -4.65 | -4.65 |
| Temple | Amer | 5.46 | 5.46 | 51.72 | 51.72 | 0.19 | 0.19 |
| Memphis | Amer | 4.01 | 4.01 | 59.38 | 59.38 | 0.75 | 0.75 |
| Houston | Amer | 4.00 | 4.00 | 80.65 | 80.65 | 2.45 | 2.45 |
| South Florida | Amer | 3.98 | 3.98 | 30.00 | 30.00 | -1.59 | -1.59 |
| Tulsa | Amer | 3.98 | 3.98 | 58.62 | 58.62 | 0.69 | 0.69 |
| East Carolina | Amer | 3.95 | 3.95 | 32.14 | 32.14 | -1.41 | -1.41 |
| SMU | Amer | 3.93 | 3.93 | 51.61 | 51.61 | 0.13 | 0.13 |
| UCF | Amer | 2.52 | 2.52 | 58.06 | 58.06 | 0.41 | 0.41 |
| Cincinnati | Amer | 2.51 | 2.51 | 87.88 | 87.88 | 1.90 | 1.90 |
| Wichita St. | Amer | 2.49 | 2.49 | 77.42 | 77.42 | 1.36 | 1.36 |
| Connecticut | Amer | 2.42 | 2.42 | 41.94 | 41.94 | -0.39 | -0.39 |
| Southeastern Louisiana | Slnd | 1.70 | 1.70 | 65.52 | 65.52 | 0.53 | 0.53 |
| Southern | SWAC | 1.70 | 1.70 | 43.33 | 43.33 | -0.23 | -0.23 |
| Fordham | A10 | 1.69 | 1.69 | 30.00 | 30.00 | -0.68 | -0.68 |
| Florida St. | ACC | 1.69 | 1.69 | 63.33 | 63.33 | 0.45 | 0.45 |
| Georgia St. | SB | 1.67 | 1.67 | 67.74 | 67.74 | 0.59 | 0.59 |
| Nicholls St. | Slnd | 1.67 | 1.67 | 62.96 | 62.96 | 0.43 | 0.43 |
| Alcorn St. | SWAC | 1.66 | 1.66 | 25.93 | 25.93 | -0.80 | -0.80 |
| LIU Brooklyn | NEC | 1.66 | 1.66 | 53.12 | 53.12 | 0.10 | 0.10 |
| Miami OH | MAC | 1.66 | 1.66 | 46.67 | 46.67 | -0.11 | -0.11 |
| South Alabama | SB | 1.66 | 1.66 | 41.38 | 41.38 | -0.29 | -0.29 |
| Colorado St. | MWC | 1.64 | 1.64 | 33.33 | 33.33 | -0.55 | -0.55 |
| North Carolina | ACC | 1.64 | 1.64 | 70.59 | 70.59 | 0.67 | 0.67 |
| New Orleans | Slnd | 0.28 | 0.28 | 42.86 | 42.86 | -0.04 | -0.04 |
| Prairie View A&M | SWAC | 0.26 | 0.26 | 45.45 | 45.45 | -0.02 | -0.02 |
| Arkansas Pine Bluff | SWAC | 0.21 | 0.21 | 40.00 | 40.00 | -0.04 | -0.04 |
| Central Arkansas | Slnd | 0.19 | 0.19 | 50.00 | 50.00 | 0.00 | 0.00 |
| Grambling St. | SWAC | 0.19 | 0.19 | 53.33 | 53.33 | 0.01 | 0.01 |
| Northwestern St. | Slnd | 0.19 | 0.19 | 8.00 | 8.00 | -0.16 | -0.16 |
| Clemson | ACC | 0.17 | 0.17 | 71.88 | 71.88 | 0.08 | 0.08 |
| McNeese St. | Slnd | 0.16 | 0.16 | 32.00 | 32.00 | -0.06 | -0.06 |
| Troy | SB | 0.16 | 0.16 | 45.16 | 45.16 | -0.02 | -0.02 |
| Louisiana Monroe | SB | 0.15 | 0.15 | 46.43 | 46.43 | -0.01 | -0.01 |
| La Salle | A10 | 0.15 | 0.15 | 40.62 | 40.62 | -0.03 | -0.03 |
| George Washington | A10 | 0.15 | 0.15 | 45.45 | 45.45 | -0.01 | -0.01 |
| Arkansas St. | SB | 0.15 | 0.15 | 30.00 | 30.00 | -0.06 | -0.06 |
| Louisville | ACC | 0.15 | 0.15 | 60.61 | 60.61 | 0.03 | 0.03 |
| Mississippi Valley St. | SWAC | 0.14 | 0.14 | 12.50 | 12.50 | -0.10 | -0.10 |
| Jackson St. | SWAC | 0.14 | 0.14 | 33.33 | 33.33 | -0.05 | -0.05 |
| Alabama A&M | SWAC | 0.13 | 0.13 | 9.68 | 9.68 | -0.11 | -0.11 |
| Louisiana Lafayette | SB | 0.13 | 0.13 | 80.65 | 80.65 | 0.08 | 0.08 |
| Alabama St. | SWAC | 0.13 | 0.13 | 25.81 | 25.81 | -0.06 | -0.06 |
| Villanova | BE | 0.13 | 0.13 | 88.24 | 88.24 | 0.10 | 0.10 |
| Appalachian St. | SB | 0.13 | 0.13 | 41.94 | 41.94 | -0.02 | -0.02 |
| Georgia Southern | SB | 0.13 | 0.13 | 61.29 | 61.29 | 0.03 | 0.03 |
| Saint Joseph's | A10 | 0.13 | 0.13 | 50.00 | 50.00 | 0.00 | 0.00 |
| LSU | SEC | 0.13 | 0.13 | 54.84 | 54.84 | 0.01 | 0.01 |
| Little Rock | SB | 0.12 | 0.12 | 20.00 | 20.00 | -0.07 | -0.07 |
| Drexel | CAA | 0.12 | 0.12 | 37.50 | 37.50 | -0.03 | -0.03 |
| Notre Dame | ACC | 0.12 | 0.12 | 57.58 | 57.58 | 0.02 | 0.02 |
| Arkansas | SEC | 0.12 | 0.12 | 67.65 | 67.65 | 0.04 | 0.04 |
| Duke | ACC | 0.12 | 0.12 | 78.79 | 78.79 | 0.07 | 0.07 |
| Stephen F. Austin | Slnd | 0.11 | 0.11 | 80.00 | 80.00 | 0.07 | 0.07 |
| Texas Southern | SWAC | 0.11 | 0.11 | 44.12 | 44.12 | -0.01 | -0.01 |
| Lamar | Slnd | 0.11 | 0.11 | 53.57 | 53.57 | 0.01 | 0.01 |
| Rutgers | B10 | 0.11 | 0.11 | 42.42 | 42.42 | -0.02 | -0.02 |
| Incarnate Word | Slnd | 0.10 | 0.10 | 12.50 | 12.50 | -0.08 | -0.08 |
| Charlotte | CUSA | 0.10 | 0.10 | 17.86 | 17.86 | -0.07 | -0.07 |
| Illinois St. | MVC | 0.10 | 0.10 | 53.12 | 53.12 | 0.01 | 0.01 |
| Western Michigan | MAC | 0.10 | 0.10 | 50.00 | 50.00 | 0.00 | 0.00 |
| Texas St. | SB | 0.10 | 0.10 | 41.94 | 41.94 | -0.02 | -0.02 |
| Oklahoma St. | B12 | 0.10 | 0.10 | 57.58 | 57.58 | 0.02 | 0.02 |
| Coppin St. | MEAC | 0.10 | 0.10 | 15.62 | 15.62 | -0.07 | -0.07 |
| Central Connecticut | NEC | 0.10 | 0.10 | 43.75 | 43.75 | -0.01 | -0.01 |
| Stetson | ASun | 0.10 | 0.10 | 28.57 | 28.57 | -0.04 | -0.04 |
| UT Arlington | SB | 0.10 | 0.10 | 60.61 | 60.61 | 0.02 | 0.02 |
| Eastern Michigan | MAC | 0.10 | 0.10 | 58.62 | 58.62 | 0.02 | 0.02 |
| Boise St. | MWC | 0.10 | 0.10 | 73.33 | 73.33 | 0.05 | 0.05 |
| Auburn | SEC | 0.10 | 0.10 | 78.12 | 78.12 | 0.06 | 0.06 |
| Northern Iowa | MVC | 0.10 | 0.10 | 46.67 | 46.67 | -0.01 | -0.01 |
| St. Francis NY | NEC | 0.10 | 0.10 | 37.93 | 37.93 | -0.02 | -0.02 |
| Miami FL | ACC | 0.10 | 0.10 | 70.97 | 70.97 | 0.04 | 0.04 |
| Wake Forest | ACC | 0.10 | 0.10 | 35.48 | 35.48 | -0.03 | -0.03 |
| Syracuse | ACC | 0.10 | 0.10 | 60.61 | 60.61 | 0.02 | 0.02 |
| Bryant | NEC | 0.10 | 0.10 | 9.68 | 9.68 | -0.08 | -0.08 |
| Houston Baptist | Slnd | 0.08 | 0.08 | 10.71 | 10.71 | -0.07 | -0.07 |
| Abilene Christian | Slnd | 0.08 | 0.08 | 44.44 | 44.44 | -0.01 | -0.01 |
| Sam Houston St. | Slnd | 0.08 | 0.08 | 51.72 | 51.72 | 0.00 | 0.00 |
| Iowa St. | B12 | 0.08 | 0.08 | 41.94 | 41.94 | -0.01 | -0.01 |
| Baylor | B12 | 0.08 | 0.08 | 54.84 | 54.84 | 0.01 | 0.01 |
| Coastal Carolina | SB | 0.08 | 0.08 | 37.93 | 37.93 | -0.02 | -0.02 |
| Kent St. | MAC | 0.08 | 0.08 | 48.48 | 48.48 | -0.00 | -0.00 |
| Manhattan | MAAC | 0.08 | 0.08 | 45.16 | 45.16 | -0.01 | -0.01 |
| Ohio | MAC | 0.08 | 0.08 | 43.33 | 43.33 | -0.01 | -0.01 |
| UMBC | AE | 0.08 | 0.08 | 67.74 | 67.74 | 0.03 | 0.03 |
| UT Rio Grande Valley | WAC | 0.08 | 0.08 | 43.33 | 43.33 | -0.01 | -0.01 |
| Western Kentucky | CUSA | 0.08 | 0.08 | 69.70 | 69.70 | 0.03 | 0.03 |
| Cleveland St. | Horz | 0.08 | 0.08 | 32.35 | 32.35 | -0.03 | -0.03 |
| FIU | CUSA | 0.08 | 0.08 | 37.93 | 37.93 | -0.02 | -0.02 |
| Buffalo | MAC | 0.08 | 0.08 | 75.76 | 75.76 | 0.04 | 0.04 |
| Wyoming | MWC | 0.08 | 0.08 | 59.38 | 59.38 | 0.01 | 0.01 |
| Georgia | SEC | 0.08 | 0.08 | 54.55 | 54.55 | 0.01 | 0.01 |
| Old Dominion | CUSA | 0.08 | 0.08 | 78.12 | 78.12 | 0.04 | 0.04 |
| Penn | Ivy | 0.08 | 0.08 | 74.19 | 74.19 | 0.04 | 0.04 |
| South Carolina | SEC | 0.08 | 0.08 | 50.00 | 50.00 | 0.00 | 0.00 |
| Wisconsin | B10 | 0.08 | 0.08 | 45.45 | 45.45 | -0.01 | -0.01 |
| Boston College | ACC | 0.08 | 0.08 | 55.88 | 55.88 | 0.01 | 0.01 |
| Davidson | A10 | 0.08 | 0.08 | 65.62 | 65.62 | 0.02 | 0.02 |
| Hartford | AE | 0.07 | 0.07 | 58.06 | 58.06 | 0.01 | 0.01 |
| Saint Louis | A10 | 0.07 | 0.07 | 50.00 | 50.00 | 0.00 | 0.00 |
| Samford | SC | 0.07 | 0.07 | 26.67 | 26.67 | -0.03 | -0.03 |
| Arizona | P12 | 0.07 | 0.07 | 79.41 | 79.41 | 0.04 | 0.04 |
| Liberty | BSth | 0.07 | 0.07 | 54.84 | 54.84 | 0.01 | 0.01 |
| Loyola MD | Pat | 0.07 | 0.07 | 26.67 | 26.67 | -0.03 | -0.03 |
| Fairfield | MAAC | 0.07 | 0.07 | 51.52 | 51.52 | 0.00 | 0.00 |
| Fairleigh Dickinson | NEC | 0.07 | 0.07 | 37.93 | 37.93 | -0.02 | -0.02 |
| Wagner | NEC | 0.07 | 0.07 | 70.00 | 70.00 | 0.03 | 0.03 |
| Alabama | SEC | 0.07 | 0.07 | 55.88 | 55.88 | 0.01 | 0.01 |
| Mercer | SC | 0.07 | 0.07 | 53.33 | 53.33 | 0.00 | 0.00 |
| North Carolina St. | ACC | 0.07 | 0.07 | 65.62 | 65.62 | 0.02 | 0.02 |
| Virginia | ACC | 0.07 | 0.07 | 93.94 | 93.94 | 0.06 | 0.06 |
| Texas A&M Corpus Chris | Slnd | 0.06 | 0.06 | 30.77 | 30.77 | -0.02 | -0.02 |
| Campbell | BSth | 0.05 | 0.05 | 46.43 | 46.43 | -0.00 | -0.00 |
| Delaware St. | MEAC | 0.05 | 0.05 | 6.67 | 6.67 | -0.05 | -0.05 |
| North Carolina A&T | MEAC | 0.05 | 0.05 | 56.25 | 56.25 | 0.01 | 0.01 |
| Radford | BSth | 0.05 | 0.05 | 62.50 | 62.50 | 0.01 | 0.01 |
| UNC Wilmington | CAA | 0.05 | 0.05 | 30.00 | 30.00 | -0.02 | -0.02 |
| Maine | AE | 0.05 | 0.05 | 13.33 | 13.33 | -0.04 | -0.04 |
| Southern Miss | CUSA | 0.05 | 0.05 | 40.00 | 40.00 | -0.01 | -0.01 |
| Air Force | MWC | 0.05 | 0.05 | 34.48 | 34.48 | -0.02 | -0.02 |
| Akron | MAC | 0.05 | 0.05 | 41.94 | 41.94 | -0.01 | -0.01 |
| Bowling Green | MAC | 0.05 | 0.05 | 46.67 | 46.67 | -0.00 | -0.00 |
| Duquesne | A10 | 0.05 | 0.05 | 50.00 | 50.00 | 0.00 | 0.00 |
| Florida A&M | MEAC | 0.05 | 0.05 | 24.24 | 24.24 | -0.03 | -0.03 |
| Fresno St. | MWC | 0.05 | 0.05 | 63.33 | 63.33 | 0.01 | 0.01 |
| Kansas St. | B12 | 0.05 | 0.05 | 66.67 | 66.67 | 0.02 | 0.02 |
| Missouri St. | MVC | 0.05 | 0.05 | 53.12 | 53.12 | 0.00 | 0.00 |
| Nevada | MWC | 0.05 | 0.05 | 79.41 | 79.41 | 0.03 | 0.03 |
| New Mexico | MWC | 0.05 | 0.05 | 54.55 | 54.55 | 0.00 | 0.00 |
| Oral Roberts | Sum | 0.05 | 0.05 | 28.57 | 28.57 | -0.02 | -0.02 |
| San Diego St. | MWC | 0.05 | 0.05 | 67.74 | 67.74 | 0.02 | 0.02 |
| San Jose St. | MWC | 0.05 | 0.05 | 10.34 | 10.34 | -0.04 | -0.04 |
| Toledo | MAC | 0.05 | 0.05 | 66.67 | 66.67 | 0.02 | 0.02 |
| Utah St. | MWC | 0.05 | 0.05 | 48.48 | 48.48 | -0.00 | -0.00 |
| UTSA | CUSA | 0.05 | 0.05 | 53.33 | 53.33 | 0.00 | 0.00 |
| VCU | A10 | 0.05 | 0.05 | 54.55 | 54.55 | 0.00 | 0.00 |
| Saint Peter's | MAAC | 0.05 | 0.05 | 43.75 | 43.75 | -0.01 | -0.01 |
| Dayton | A10 | 0.05 | 0.05 | 45.16 | 45.16 | -0.00 | -0.00 |
| Massachusetts | A10 | 0.05 | 0.05 | 39.39 | 39.39 | -0.01 | -0.01 |
| Missouri | SEC | 0.05 | 0.05 | 61.29 | 61.29 | 0.01 | 0.01 |
| Oregon | P12 | 0.05 | 0.05 | 64.71 | 64.71 | 0.02 | 0.02 |
| West Virginia | B12 | 0.05 | 0.05 | 70.59 | 70.59 | 0.02 | 0.02 |
| Bethune Cookman | MEAC | 0.05 | 0.05 | 53.33 | 53.33 | 0.00 | 0.00 |
| Elon | CAA | 0.05 | 0.05 | 40.00 | 40.00 | -0.01 | -0.01 |
| Florida Atlantic | CUSA | 0.05 | 0.05 | 32.14 | 32.14 | -0.02 | -0.02 |
| Howard | MEAC | 0.05 | 0.05 | 25.81 | 25.81 | -0.02 | -0.02 |
| Indiana | B10 | 0.05 | 0.05 | 51.61 | 51.61 | 0.00 | 0.00 |
| Morgan St. | MEAC | 0.05 | 0.05 | 36.67 | 36.67 | -0.01 | -0.01 |
| Northern Arizona | BSky | 0.05 | 0.05 | 13.33 | 13.33 | -0.04 | -0.04 |
| Florida | SEC | 0.05 | 0.05 | 62.50 | 62.50 | 0.01 | 0.01 |
| Richmond | A10 | 0.05 | 0.05 | 37.50 | 37.50 | -0.01 | -0.01 |
| Stony Brook | AE | 0.05 | 0.05 | 38.71 | 38.71 | -0.01 | -0.01 |
| Georgia Tech | ACC | 0.05 | 0.05 | 40.62 | 40.62 | -0.01 | -0.01 |
| Ohio St. | B10 | 0.05 | 0.05 | 75.00 | 75.00 | 0.02 | 0.02 |
| Pittsburgh | ACC | 0.05 | 0.05 | 25.00 | 25.00 | -0.02 | -0.02 |
| Virginia Tech | ACC | 0.05 | 0.05 | 65.62 | 65.62 | 0.02 | 0.02 |
| Savannah St. | MEAC | 0.05 | 0.05 | 43.33 | 43.33 | -0.01 | -0.01 |
| Cal Poly | BW | 0.05 | 0.05 | 24.14 | 24.14 | -0.03 | -0.03 |
| Mount St. Mary's | NEC | 0.05 | 0.05 | 53.33 | 53.33 | 0.00 | 0.00 |
| Providence | BE | 0.05 | 0.05 | 61.76 | 61.76 | 0.01 | 0.01 |
| Robert Morris | NEC | 0.05 | 0.05 | 48.48 | 48.48 | -0.00 | -0.00 |
| Sacred Heart | NEC | 0.05 | 0.05 | 30.00 | 30.00 | -0.02 | -0.02 |
| St. Francis PA | NEC | 0.05 | 0.05 | 57.14 | 57.14 | 0.01 | 0.01 |
| TCU | B12 | 0.05 | 0.05 | 65.62 | 65.62 | 0.02 | 0.02 |
| USC | P12 | 0.05 | 0.05 | 67.65 | 67.65 | 0.02 | 0.02 |
| Michigan St. | B10 | 0.05 | 0.05 | 87.88 | 87.88 | 0.04 | 0.04 |
| Albany | AE | 0.05 | 0.05 | 67.74 | 67.74 | 0.02 | 0.02 |
| Northern Kentucky | Horz | 0.05 | 0.05 | 68.97 | 68.97 | 0.02 | 0.02 |
| Siena | MAAC | 0.05 | 0.05 | 25.00 | 25.00 | -0.02 | -0.02 |
| UAB | CUSA | 0.05 | 0.05 | 58.06 | 58.06 | 0.01 | 0.01 |
| Western Carolina | SC | 0.05 | 0.05 | 36.67 | 36.67 | -0.01 | -0.01 |
| Creighton | BE | 0.03 | 0.03 | 64.52 | 64.52 | 0.01 | 0.01 |
| Idaho | BSky | 0.03 | 0.03 | 68.97 | 68.97 | 0.01 | 0.01 |
| Presbyterian | BSth | 0.03 | 0.03 | 27.59 | 27.59 | -0.01 | -0.01 |
| Seattle | WAC | 0.03 | 0.03 | 56.67 | 56.67 | 0.00 | 0.00 |
| Vanderbilt | SEC | 0.03 | 0.03 | 37.50 | 37.50 | -0.01 | -0.01 |
| Yale | Ivy | 0.03 | 0.03 | 50.00 | 50.00 | 0.00 | 0.00 |
| Eastern Illinois | OVC | 0.03 | 0.03 | 34.48 | 34.48 | -0.01 | -0.01 |
| SIU Edwardsville | OVC | 0.03 | 0.03 | 30.00 | 30.00 | -0.01 | -0.01 |
| Texas Tech | B12 | 0.03 | 0.03 | 72.73 | 72.73 | 0.01 | 0.01 |
| Valparaiso | MVC | 0.03 | 0.03 | 43.33 | 43.33 | -0.00 | -0.00 |
| Austin Peay | OVC | 0.03 | 0.03 | 53.33 | 53.33 | 0.00 | 0.00 |
| Ball St. | MAC | 0.03 | 0.03 | 58.06 | 58.06 | 0.00 | 0.00 |
| Central Michigan | MAC | 0.03 | 0.03 | 53.33 | 53.33 | 0.00 | 0.00 |
| Charleston Southern | BSth | 0.03 | 0.03 | 42.86 | 42.86 | -0.00 | -0.00 |
| Colorado | P12 | 0.03 | 0.03 | 53.12 | 53.12 | 0.00 | 0.00 |
| DePaul | BE | 0.03 | 0.03 | 35.48 | 35.48 | -0.01 | -0.01 |
| East Tennessee St. | SC | 0.03 | 0.03 | 71.88 | 71.88 | 0.01 | 0.01 |
| Fort Wayne | Sum | 0.03 | 0.03 | 50.00 | 50.00 | 0.00 | 0.00 |
| George Mason | A10 | 0.03 | 0.03 | 48.48 | 48.48 | -0.00 | -0.00 |
| Harvard | Ivy | 0.03 | 0.03 | 56.67 | 56.67 | 0.00 | 0.00 |
| Illinois | B10 | 0.03 | 0.03 | 41.94 | 41.94 | -0.00 | -0.00 |
| Iowa | B10 | 0.03 | 0.03 | 42.42 | 42.42 | -0.00 | -0.00 |
| Kennesaw St. | ASun | 0.03 | 0.03 | 28.57 | 28.57 | -0.01 | -0.01 |
| Long Beach St. | BW | 0.03 | 0.03 | 41.94 | 41.94 | -0.00 | -0.00 |
| Marshall | CUSA | 0.03 | 0.03 | 69.70 | 69.70 | 0.01 | 0.01 |
| New Mexico St. | WAC | 0.03 | 0.03 | 83.33 | 83.33 | 0.02 | 0.02 |
| North Carolina Central | MEAC | 0.03 | 0.03 | 51.61 | 51.61 | 0.00 | 0.00 |
| Northern Illinois | MAC | 0.03 | 0.03 | 36.67 | 36.67 | -0.01 | -0.01 |
| Rhode Island | A10 | 0.03 | 0.03 | 78.12 | 78.12 | 0.01 | 0.01 |
| Sacramento St. | BSky | 0.03 | 0.03 | 16.67 | 16.67 | -0.02 | -0.02 |
| St. Bonaventure | A10 | 0.03 | 0.03 | 78.12 | 78.12 | 0.01 | 0.01 |
| Tennessee Martin | OVC | 0.03 | 0.03 | 27.59 | 27.59 | -0.01 | -0.01 |
| The Citadel | SC | 0.03 | 0.03 | 27.59 | 27.59 | -0.01 | -0.01 |
| UNLV | MWC | 0.03 | 0.03 | 60.61 | 60.61 | 0.01 | 0.01 |
| Western Illinois | Sum | 0.03 | 0.03 | 33.33 | 33.33 | -0.01 | -0.01 |
| Winthrop | BSth | 0.03 | 0.03 | 57.14 | 57.14 | 0.00 | 0.00 |
| Wright St. | Horz | 0.03 | 0.03 | 71.88 | 71.88 | 0.01 | 0.01 |
| Boston University | Pat | 0.03 | 0.03 | 46.67 | 46.67 | -0.00 | -0.00 |
| California | P12 | 0.03 | 0.03 | 25.81 | 25.81 | -0.01 | -0.01 |
| Chattanooga | SC | 0.03 | 0.03 | 25.81 | 25.81 | -0.01 | -0.01 |
| Colgate | Pat | 0.03 | 0.03 | 58.06 | 58.06 | 0.00 | 0.00 |
| College of Charleston | CAA | 0.03 | 0.03 | 77.42 | 77.42 | 0.01 | 0.01 |
| Columbia | Ivy | 0.03 | 0.03 | 26.92 | 26.92 | -0.01 | -0.01 |
| Eastern Washington | BSky | 0.03 | 0.03 | 56.25 | 56.25 | 0.00 | 0.00 |
| Florida Gulf Coast | ASun | 0.03 | 0.03 | 64.52 | 64.52 | 0.01 | 0.01 |
| Gardner Webb | BSth | 0.03 | 0.03 | 37.93 | 37.93 | -0.01 | -0.01 |
| Marquette | BE | 0.03 | 0.03 | 59.38 | 59.38 | 0.00 | 0.00 |
| Mississippi | SEC | 0.03 | 0.03 | 37.50 | 37.50 | -0.01 | -0.01 |
| Monmouth | MAAC | 0.03 | 0.03 | 35.48 | 35.48 | -0.01 | -0.01 |
| Montana | BSky | 0.03 | 0.03 | 77.42 | 77.42 | 0.01 | 0.01 |
| Nebraska | B10 | 0.03 | 0.03 | 68.75 | 68.75 | 0.01 | 0.01 |
| Oklahoma | B12 | 0.03 | 0.03 | 58.06 | 58.06 | 0.00 | 0.00 |
| Rice | CUSA | 0.03 | 0.03 | 17.24 | 17.24 | -0.02 | -0.02 |
| South Carolina St. | MEAC | 0.03 | 0.03 | 26.67 | 26.67 | -0.01 | -0.01 |
| South Dakota St. | Sum | 0.03 | 0.03 | 80.00 | 80.00 | 0.02 | 0.02 |
| St. John's | BE | 0.03 | 0.03 | 46.88 | 46.88 | -0.00 | -0.00 |
| UMKC | WAC | 0.03 | 0.03 | 27.59 | 27.59 | -0.01 | -0.01 |
| William & Mary | CAA | 0.03 | 0.03 | 58.62 | 58.62 | 0.00 | 0.00 |
| Binghamton | AE | 0.02 | 0.02 | 31.03 | 31.03 | -0.01 | -0.01 |
| Brown | Ivy | 0.02 | 0.02 | 38.46 | 38.46 | -0.01 | -0.01 |
| NJIT | ASun | 0.02 | 0.02 | 42.86 | 42.86 | -0.00 | -0.00 |
| UMass Lowell | AE | 0.02 | 0.02 | 37.93 | 37.93 | -0.01 | -0.01 |
| Mississippi St. | SEC | 0.02 | 0.02 | 65.62 | 65.62 | 0.01 | 0.01 |
| UCLA | P12 | 0.02 | 0.02 | 65.62 | 65.62 | 0.01 | 0.01 |
| Xavier | BE | 0.02 | 0.02 | 84.85 | 84.85 | 0.02 | 0.02 |
| Bucknell | Pat | 0.02 | 0.02 | 73.53 | 73.53 | 0.01 | 0.01 |
| Michigan | B10 | 0.02 | 0.02 | 79.41 | 79.41 | 0.01 | 0.01 |
| Portland | WCC | 0.02 | 0.02 | 24.14 | 24.14 | -0.01 | -0.01 |
| Stanford | P12 | 0.02 | 0.02 | 54.55 | 54.55 | 0.00 | 0.00 |
| Tennessee | SEC | 0.02 | 0.02 | 75.76 | 75.76 | 0.01 | 0.01 |
| Wofford | SC | 0.02 | 0.02 | 60.00 | 60.00 | 0.00 | 0.00 |