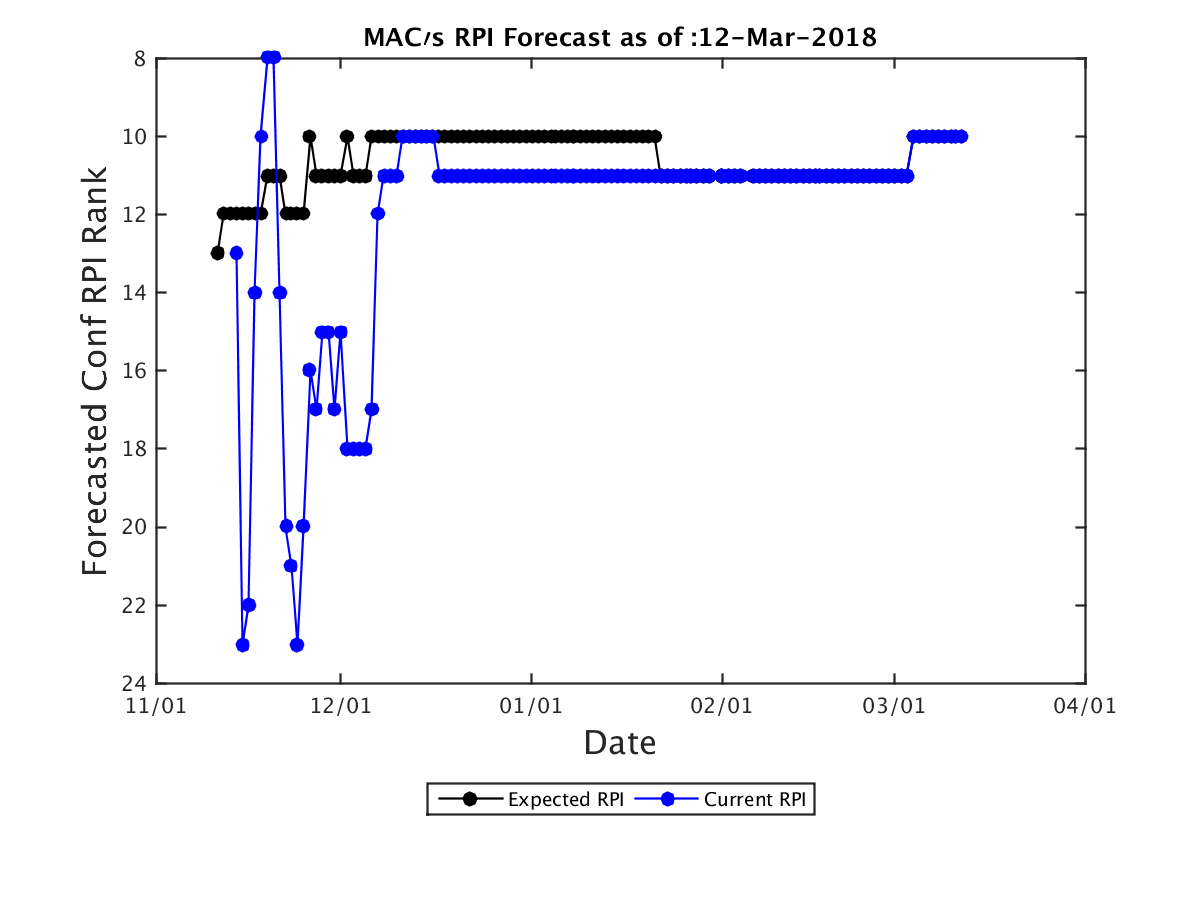
| Expected RPI: | 10 |
| Current RPI: | 10 |
| Current OOC Record: | 75-58 (0.5639) |
| Expected OOC Record: | 75-58 (0.5639) |
| Expected OOC RPI: | 12 |
| Expected OOC SOS: | 27 |
| Expected RPI Rank | Team | RPI Forecast | SOS Forecast | SOS Rank Forecast | Curr W-L | Proj W-L | Current Conf W-L | Proj Conf W-L | 1-25 W-L | 26-50 W-L | 51-100 W-L | 101-200 W-L | 200+ W-L | Proj OOC W-L | Proj OOC RPI | Proj OOC SOS | Current RPI |
|---|---|---|---|---|---|---|---|---|---|---|---|---|---|---|---|---|---|
| 25.0 | Buffalo | 0.5998 | 0.5390 | 83 | 25-8 | 25-8 | 18-3 | 18-3 | 0-2 | 0-3 | 2-0 | 16-2 | 7-1 | 7-5 | 34 | 9 | 25 |
| 75.0 | Toledo | 0.5584 | 0.5195 | 114 | 22-11 | 22-11 | 15-6 | 15-6 | 0-3 | 0-1 | 0-2 | 12-4 | 10-1 | 7-5 | 114 | 119 | 75 |
| 116.0 | Eastern Michigan | 0.5290 | 0.4993 | 151 | 17-12 | 17-12 | 12-8 | 12-8 | 0-1 | 0-1 | 2-1 | 9-6 | 6-3 | 5-4 | 163 | 297 | 116 |
| 126.0 | Ball St. | 0.5232 | 0.4971 | 159 | 18-13 | 18-13 | 10-9 | 10-9 | 0-1 | 0-1 | 3-2 | 6-8 | 9-1 | 8-4 | 109 | 246 | 126 |
| 154.0 | Kent St. | 0.5085 | 0.5230 | 107 | 16-17 | 16-17 | 11-10 | 11-10 | 1-4 | 0-0 | 0-3 | 8-7 | 7-3 | 5-7 | 197 | 116 | 154 |
| 159.0 | Miami OH | 0.5044 | 0.5140 | 126 | 14-17 | 14-17 | 9-11 | 9-11 | 1-2 | 0-1 | 1-2 | 4-10 | 8-2 | 5-6 | 136 | 146 | 159 |
| 167.0 | Central Michigan | 0.5020 | 0.4928 | 176 | 16-14 | 16-14 | 8-12 | 8-12 | 0-3 | 0-0 | 0-2 | 5-7 | 11-2 | 8-2 | 106 | 323 | 167 |
| 177.0 | Western Michigan | 0.4970 | 0.5006 | 150 | 15-15 | 15-15 | 9-10 | 9-10 | 0-2 | 0-0 | 0-5 | 7-6 | 8-2 | 6-5 | 215 | 292 | 177 |
| 193.0 | Bowling Green | 0.4870 | 0.4897 | 188 | 14-16 | 14-16 | 7-12 | 7-12 | 0-2 | 0-0 | 0-3 | 6-6 | 8-5 | 7-4 | 166 | 296 | 193 |
| 204.0 | Ohio | 0.4811 | 0.5098 | 130 | 13-17 | 13-17 | 7-12 | 7-12 | 0-3 | 1-0 | 0-4 | 6-9 | 6-1 | 6-5 | 194 | 189 | 204 |
| 227.0 | Akron | 0.4678 | 0.4985 | 153 | 13-18 | 13-18 | 7-13 | 7-13 | 0-2 | 0-2 | 0-3 | 5-9 | 8-2 | 6-5 | 245 | 299 | 227 |
| 241.0 | Northern Illinois | 0.4599 | 0.5012 | 149 | 11-19 | 11-19 | 6-13 | 6-13 | 1-1 | 0-0 | 0-3 | 5-11 | 5-4 | 5-6 | 258 | 308 | 241 |