
back to rpi forecast
What is the RPI Forecast?
The RPI Forecast is a prediction of what a team's RPI will be at the end of the regular season. It is an overall better prediction of the end-of-season RPI than the daily RPI is.
The Forecasts are updated daily.
How does the RPI Forecast Work?
Basically, I take all the games that have already been completed as given and then using probabilities of winning, I simulate 10,000 separate seasons.
Once I have done this, I calculate the RPI and RPI rank for each simulation. The expected RPI and RPI Rank are the sample averages from all 10,000 simulations.
Here are the steps in detail:
- Update all of the wins and losses to date
- Using Jeff Sagarin's "PREDICTOR", calculate the probabilities of winning for every remaining game
- Draw random Wins and Losses based on these probabilities for every remaining game
- Figure out the end of season RPI for every team based on the completed and simulated wins and losses
- Sort the RPIs (numbers between 0 and 1) to get RPI ranks (counting numbers, 1, 2, 3, etc.)
- Save the details from this one simulation
- Repeat the simulation 10,000 times
- Calculate the Expected RPI and Expected RPI Rank, etc., by using my 10,000 simulations
How do you figure out the probability that one team beats another?
I use Jeff Sagarin's "PREDICTOR" to predict the "expected" margin of victory between any two teams. Becuase this is only what you would expect on average, I combinine that with a standard deviation to come up with a probability of victory. Jeff Sagarin's "PREDICTOR" is consistently the best rating available at precicting future outcomes. Thanks Jeff for making the data available. I DO NOT USE THE CURRENT RPI TO FORECAST FUTURE WINS/LOSSES!
Why try to predict the end-of-season RPI?
The day-to-day RPI is based only on games that have already taken place.
That's fine if you just want to know how a team stands right now and believe that the RPI is a good measure.
However, as far as the NCAA Selection committee is concerned, all that matters is your RPI come selection Sunday. At that point, a team's RPI in January is meaningless.
The important question is whether the RPI in December is a good indication of what it will look like in March.
My contention is that there are better ways to predict what the end-of-season RPI will look like than by simply looking at the RPI so far.
How is the RPI forecast different than the day-to-day RPI that the NCAA releases?
One of the most commonly criticized elements of the RPI is that if you blow out a bad team, your rating may actually drop.
This is because the RPI consists not only of your (adjusted) winning percentage, but also the winning percentages of your (past) opponents and their (past) opponents.
The end-of-season RPI forecasts on this page include all past and future opponents in a team's Strength of Schedule and as such should give a better measure of what the RPI will look like on Selection Sunday than the day-to-day RPI.
After all, that is what really matters.
Including future opponents only makes sense if you realize that the future opponents may be better or worse than all past opponents and adjust your winning percentage accordingly.
I accomplish this by calculating probabilities of winning for each future game by using data from past games.
Once I have calculated these probabilities, I determine the most likely outcome of all future games.
This is the most important part of the RPI forecast.
How is the RPI forecast similar to the day-to-day RPI that the NCAA releases?
Aside from the fact that I include past AND future opponents and make forecasts of future games, the two are calculated exactly the same.
In fact, as the end of the season nears, the two measures will converge.
Will the RPI forecasts on this page really give me a better idea of what the RPI will look like on Selection Sunday than the regular day-to-day RPI?
I contend that on average, it will do better than the regular RPI at forecasting the end-of-season RPI.
There will be a small few teams for which, for one reason or another, the regular RPI will do better, but on average, the RPI forecasts will be closer.
This will be particularly true early in the season.
Both measures will do better as time progresses, but mine will do better for the average team.
How do I know this?
I have backtested my model for previous seasons and found that the Root Mean Squared Error AND the Mean Absolute Difference in predicting the Rank is lower for the RPI Forecast than for the RPI itself.
Also, now that I have a season (2006-07) under the belt, we can look at those results too. In forecasting the RPI, I included only games that were on the schedule at the time, so that means that up until the last week or so, no Conference Tournament games were on the schedule. So, with that in mind, here is a graph showing the ability of the RPI Forecast at predicting the end-of-regular-season RPI versus the ability of the daily RPI to do so. What you see below is the Mean Absolute Deviation of the RPI Forecast and today's RPI and the MEAN Absolute Deviation of the daily RPI and today's RPI plotted over time as the season progressed. The Mean Absolute Deviation is the the average difference between the RPI Forecast or daily RPI and today's RPI. It just tells you how far away you expect the average forecast to be. Lower is better.
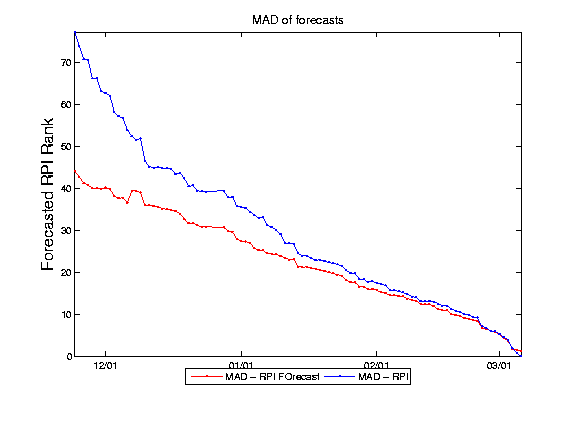
As you can see, the RPI Forecast did better than the daily RPI at predicting the end-of-regular-season RPI. The diference is much better early on in the season, when the average error for the daily rpi is about 80 and the RPI forecast is about 40 spots away on average.
What does the Overrated column mean?
The Overrated column is: Expected RPI Rank - day-to-day RPI Rank.
By overrated, I mean overrated as far as the day-to-day RPI goes.
A team with a very high (positive) score is a team that I predict will end up with a much lower RPI than the current day-to-day RPI indicates.
A team might fall into the overrated category for several reasons.
For example, a team might end up in this category is one that has won all of its games against relatively good opponents, but all of its remaining games are against weak opponents.
It will not be able to increase it's winning percentage which is already 100%, but it's SOS will only go down.
What does the tstat column mean?
This column is equal to the Overrated value divided by the standard deviation of the Expected RPI Rank.
This is arguably a better measure of how over/underrated a team is because it takes into account how hard it is to forecast the RPI for each team.
You can think of it as how many standard deviations away the daily RPI is from the Expected RPI Rank.
What is up with the Simulations Page?
The RPI rank is more difficult to forecast than the RPI itself.
Once I figure out the probabilities over the individual games, it is fairly straightforward to calculate the expected winning percentage for each team, and thus the RPI.
It is tempting to just take these RPI forecasts and sort them and call that the RPI Rank Forecast.
However, some of you will be familiar with something called Jensen's Inequality.
Basically, because the mapping between the RPI (i.e, the number between 0 and 1) and the RPI Rank (i.e., 1, 2, 3, etc.) is nonlinear, the rank of the expected RPI is not the same as the expected RPI rank.
In order to figure out what I expect the RPI Rank to be on Selection Sunday, I take the probabilities over each game and taking all of the completed games as give, run a simulated season treating each game
as a random variable. I do this for each game for the rest of the season and then calculate the RPIs and sort them. I do this many many times and now I have a simulated distribution of realized RPI ranks.
Now, I can take an average, which is just an expectation, and say something about what I expect the RPI rank to be. The numbers on the Simulation page are just the resulting characteristics of these simulations.
You can look at some of the percentiles for each team on the page, or you can look at a histogram of all of the results for each team by clicking on the team's name.
Why are the the Expected Ranks not round numbers?
Because they are expectations. To illustrate this, assume there were only two teams in D1 and they only met once and the probability that each won was 1/2. Well, ignoring all of the intricacies of the RPI formula, the expected ranks would be 1.5 for each of them.
What is the 95% confidence interval?
The 95% confidence interval basically just tells you that 95% of the simlated RPIs for that particular day fall within those two bounds. This does not necessarily mean that at the end of the season, the final RPI will fall within those bounds for 95% of the teams for every single day of forecasts throughout the season. What it does mean is that given everything we know about the teams in terms of their future schedules and Jeff Sagarin's current PREDICTOR, that is our best guess at the 95% confidence interval. Because teams can improve (or get worse) over the course of a season, the probabilites over future games may also change, which is why you might see the confidence intervals changing. Much like the Expected RPI can change, the confidence intervals can change. Obviously, they should improve over time. The past predictions are only presented to show that on average, the RPI forecast does better than the daily RPI. The most meaningful forecasts are the most recent ones.
Can you describe all of the variables?
Heck yes, I can:
Team Page
- Expected RPI Rank: This is what I expect the RPI rank to be at the end of the season. It is probably what you came to my webpage for.
- Overall: This is the one most likely end of season rank outcome. Because the Expected RPI Ranks are not usually round numbers, I added this variable which is basically the rank of the RPI Forecast (which are the numbers between 0 and 1. See below) and not necessarily of the Expected RPI Rank. The Expected RPI Rank is still a better measure of an individual team's future RPI rank, but if you want to see standard ranks (1, 2, 3, etc.) then you may like this more.
- Team: The name of the basketball team's school. Click on this to look at a graph of the Expected RPI Rank forecasts over time, and a histogram of today's simulations.
- Conf: The conference of the basketball team's school. Click on this to look at the time series of RPI forecasts by conference.
- RPI Forecast:This is what I expect the RPI (not the RPI rank, mind you!) to be at the end of the season. The RPI Rank is more important.
- SOS Forecast (rank):This is a forecast of the Strength of Schedule for each team. The SOS is basically your (2/3) * Opponents' winning percentage + (1/3) * Opponents' Opponents' winning percentage. The rank is just a sorting of the SOS number.
- Current W-L:This is the CURRENT record of the team versus Division 1 opponents.
- Projected W-L:This is what I expect the team's D1 record to be once they have played all of their games on the schedule as of today. It is based on probabilities of winning which are derived using all games to date.
- 1-25 W-L:This is what I expect the team's D1 record to be against the top-25 RPI teams at the end of the season.
- 26-50 W-L:This is what I expect the team's D1 record to be against the 26-50 RPI ranked teams at the end of the season.
- 51-100 W-L:This is what I expect the team's D1 record to be against the 51-100 RPI ranked teams at the end of the season.
- 101-200 W-L:This is what I expect the team's D1 record to be against the 200-336 RPI ranked teams at the end of the season.
- 200+ W-L:This is what I expect the team's D1 record to be against the 101-200 RPI ranked teams at the end of the season.
- OOC W-L forecast:Just like the Projected W-L, except restricted to Out of conference (or non-conference) opponents.
- OOC RPI forecast:This is the RANK of the forecasted OOC RPI. The OOC RPI is just the RPI applied to non-conference opponents.
- OOC SOS forecast:This is the RANK of the forecasted OOC SOS. The OOC SOS is just the SOS applied to non-conference opponents.
- Current RPI:This is the RANK of the current day-to-day RPI. This is the traditional RPI, calculated using only games-to-date.
- Overrated:This equal to: Expected RPI Rank - Current RPI. It is a measure of how overrated I think the team if you rely on the traditional day-to-day RPI. Teams with negative overrated values are underrated.
- t-stat:This is equal to: Overrated / (Standard Deviation of RPI Rank Forecast). This measures how many standard deviations away the current RPI is from the Expected RPI Rank.
Conference Page
- Rank: This is the rank of the projected RPI for the conference.
- Conference: The name of the D1 basketball conference. Click on this to look at a graph of the RPI Rank forecasts over time.
- RPI Forecast:This is what I expect the RPI (between 0 and 1) to be at the end of the season.
- SOS Forecast (rank):This is a forecast of the Strength of Schedule for each team. The SOS is basically your (2/3) * Opponents' winning percentage + (1/3) * Opponents' Opponents' winning percentage. The rank is just a sorting of the SOS number.
OOC W-L forecast:This is what I expect the conference's Non-conference D1 record to be once they have played all of their games on the schedule as of today. It is based on probabilities of winning which are derived using all games to date.
- pctg.:This is the OOC W-L forecast expressed as a winning percentage.
- OOC RPI forecast (rank):This is what I expect the RPI (between 0 and 1) to be at the end of the season. The rank is the sorting of the OOC RPI forecast.
- OOC SOS forecast (rank):This is the Out of conference Strength of Schedule forecast for the conference. The rank is the sorting of the OOC RPI forecast.
Simulations Page
- Expected RPI Rank: This is what I expect the RPI rank to be at the end of the season. It is probably what you came to my webpage for. It is the average rank from all of the simulations.
- Team: The name of the basketball team's school. Click on this to look at a graph of the Expected RPI Rank forecasts over time, and a histogram of today's simulations.
- Conf: The conference of the basketball team's school. Click on this to look at the time series of RPI forecasts by conference.
- Standard Deviation:This is The Standard deviation of the RPI Rank forecasts. It is calculated from the simulations.
- Min:This is the minimum (or closest to 1) RPI rank from the simulations for the team. You can think of it as the best case scenario for the team.
- 2.5th %ile:This is the 2.5th percentile RPI rank taken from the simulations. It forms the lower part of the 95% confidence interval.
- 10th %ile:This is the 10th percentile RPI rank taken from the simulations.
- 25th %ile:This is the 25th percentile RPI rank taken from the simulations.
- median:This is the median or 50th percentile RPI rank taken from the simulations. If the distribution is skewed, which it is for very good and very bad teams, it might be a better measure of expected RPI rank. Half of the simulated ranks were at least as high and half were at least as low as this rank.
- 75th %ile:This is the 75th percentile RPI rank taken from the simulations.
- 90th %ile:This is the 90th percentile RPI rank taken from the simulations.
- 2.5th %ile:This is the 97.5th percentile RPI rank taken from the simulations. It forms the upper part of the 95% confidence interval.
- Min:This is the maximum (or closest to 336) RPI rank from the simulations for the team. You can think of it as the worst case scenario for the team.
More Questions?
email me
How Can I help?
If you like what you see and want to see the RPI Forecast continue, you can paypal any amount you like to: rpiforecast@gmail.com. Of course, this is only voluntary. Also, share the site with your friends.
back to rpi forecast