
 - Blog
| Conference: | WCC |
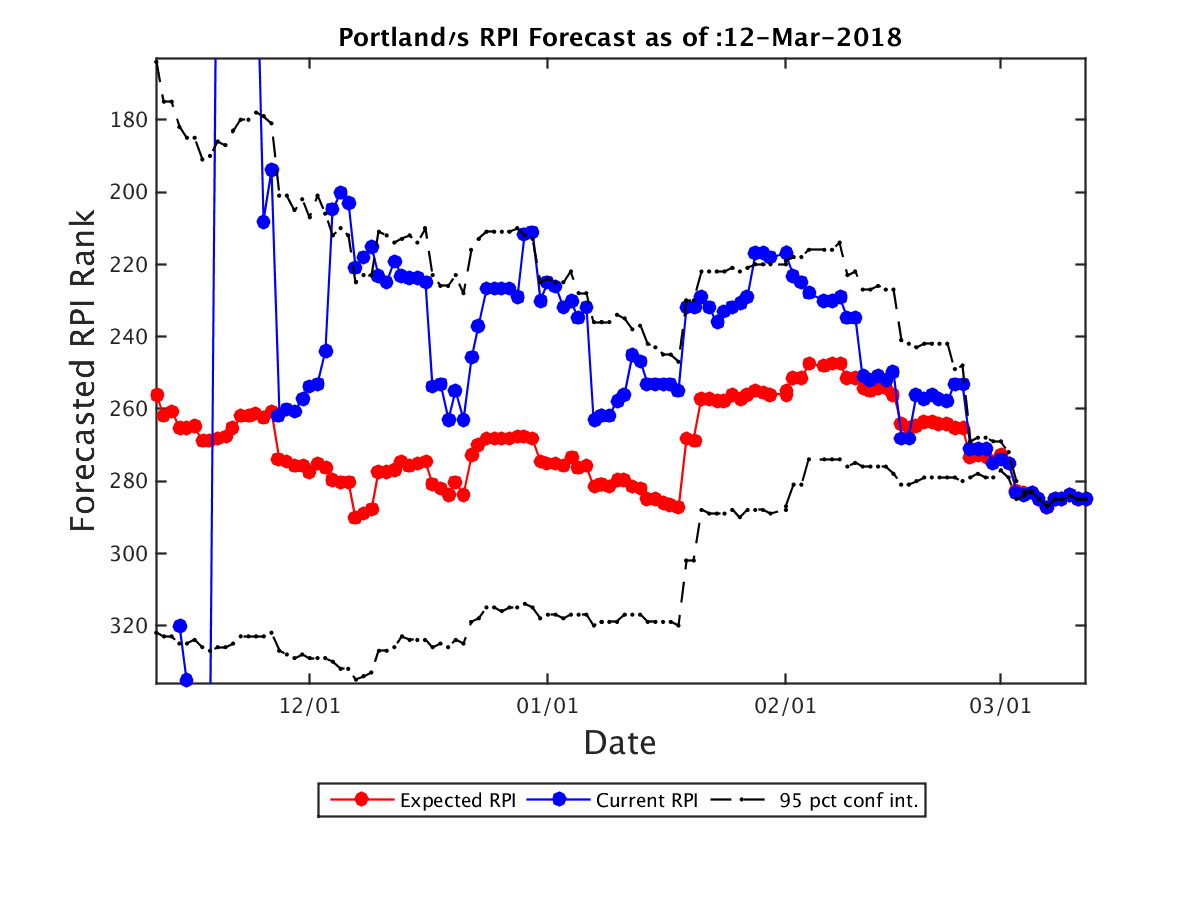
| Expected RPI: | 285.0 |
| Current RPI: | 285 |
| Expected SOS: | 141 |
| Current SOS: | 141 |
| Current Record: | 7-22 |
| Expected Record: | 7-22 |
| Current Conf Record: | 4-15 |
| Expected Conf Record: | 4-15 |
| Expected Record vs RPI 1-25: | 0-3 |
| Expected Record vs RPI 26-50: | 0-4 |
| Expected Record vs RPI 51-100: | 0-2 |
| Expected Record vs RPI 101-200: | 2-9 |
| Expected Record vs RPI 200+: | 5-4 |
| Current OOC Record: | 3-7 |
| Expected OOC Record: | 3-7 |
| Expected OOC RPI: | 270 |
| Expected OOC SOS: | 159 |
| Final Record | Expected RPI | Probability |
|---|---|---|
| 7-22 | 285.0 | 100.00% |
| Date | Opponent (Expected RPI) | Conf | Location | Score | Outcome | Prob(W) | Spread |
|---|---|---|---|---|---|---|---|
| 11-11 | Portland St. (170.0) | BSky | H | 75-80 | L | 0% | 0.0 |
| 11-23 | North Carolina (4.0) | ACC | N | 78-102 | L | 0% | 0.0 |
| 11-24 | Oklahoma (49.0) | B12 | N | 71-93 | L | 0% | 0.0 |
| 11-26 | DePaul (186.0) | BE | N | 69-82 | L | 0% | 0.0 |
| 12-3 | Boise St. (50.0) | MWC | A | 77-54 | L | 0% | 0.0 |
| 12-6 | Cal St. Fullerton (131.0) | BW | H | 66-76 | L | 0% | 0.0 |
| 12-9 | San Jose St. (314.0) | MWC | H | 64-55 | W | 100% | 0.0 |
| 12-16 | Seattle (165.0) | WAC | A | 89-76 | L | 0% | 0.0 |
| 12-19 | Hartford (198.0) | AE | H | 78-67 | W | 100% | 0.0 |
| 12-21 | Sacramento St. (309.0) | BSky | N | 75-80 | W | 100% | 0.0 |
| 12-28 | BYU (67.0) | WCC | A | 69-45 | L | 0% | 0.0 |
| 12-30 | San Francisco (139.0) | WCC | H | 61-84 | L | 0% | 0.0 |
| 1-4 | San Diego (143.0) | WCC | H | 74-81 | L | 0% | 0.0 |
| 1-6 | Santa Clara (264.0) | WCC | A | 70-68 | L | 0% | 0.0 |
| 1-11 | Gonzaga (21.0) | WCC | A | 103-57 | L | 0% | 0.0 |
| 1-13 | Pacific (190.0) | WCC | H | 54-66 | L | 0% | 0.0 |
| 1-18 | San Diego (143.0) | WCC | A | 49-55 | W | 100% | 0.0 |
| 1-20 | Loyola Marymount (258.0) | WCC | A | 65-72 | W | 100% | 0.0 |
| 1-25 | Gonzaga (21.0) | WCC | H | 79-95 | L | 0% | 0.0 |
| 1-27 | Saint Mary's (40.0) | WCC | A | 72-55 | L | 0% | 0.0 |
| 2-1 | Pepperdine (317.0) | WCC | H | 85-76 | W | 100% | 0.0 |
| 2-3 | Loyola Marymount (258.0) | WCC | H | 68-66 | W | 100% | 0.0 |
| 2-8 | San Francisco (139.0) | WCC | A | 65-63 | L | 0% | 0.0 |
| 2-10 | Pacific (190.0) | WCC | A | 60-58 | L | 0% | 0.0 |
| 2-15 | Santa Clara (264.0) | WCC | H | 72-81 | L | 0% | 0.0 |
| 2-17 | Saint Mary's (40.0) | WCC | H | 61-73 | L | 0% | 0.0 |
| 2-22 | BYU (67.0) | WCC | H | 60-72 | L | 0% | 0.0 |
| 2-24 | Pepperdine (317.0) | WCC | A | 75-64 | L | 0% | 0.0 |
| 3-2 | Loyola Marymount (258.0) | WCC | N | 78-72 | L | 0% | 0.0 |
| Team | Conf | Curr Wgt | Fut Wgt | Curr W/L | Exp W/L | Curr Impact | Exp Impact |
|---|---|---|---|---|---|---|---|
| Portland | WCC | 26.41 | 26.41 | 21.99 | 21.99 | -14.80 | -14.80 |
| Loyola Marymount | WCC | 6.18 | 6.18 | 33.33 | 33.33 | -2.06 | -2.06 |
| Saint Mary's | WCC | 4.61 | 4.61 | 83.87 | 83.87 | 3.12 | 3.12 |
| Gonzaga | WCC | 4.58 | 4.58 | 87.50 | 87.50 | 3.44 | 3.44 |
| BYU | WCC | 4.55 | 4.55 | 68.75 | 68.75 | 1.71 | 1.71 |
| San Francisco | WCC | 4.52 | 4.52 | 50.00 | 50.00 | 0.00 | 0.00 |
| Pepperdine | WCC | 4.49 | 4.49 | 13.79 | 13.79 | -3.25 | -3.25 |
| Santa Clara | WCC | 4.49 | 4.49 | 29.63 | 29.63 | -1.83 | -1.83 |
| San Diego | WCC | 4.46 | 4.46 | 57.14 | 57.14 | 0.64 | 0.64 |
| Pacific | WCC | 4.43 | 4.43 | 37.93 | 37.93 | -1.07 | -1.07 |
| Sacramento St. | BSky | 1.97 | 1.97 | 17.24 | 17.24 | -1.29 | -1.29 |
| Portland St. | BSky | 1.96 | 1.96 | 55.17 | 55.17 | 0.20 | 0.20 |
| San Jose St. | MWC | 1.92 | 1.92 | 10.71 | 10.71 | -1.51 | -1.51 |
| Cal St. Fullerton | BW | 1.89 | 1.89 | 60.71 | 60.71 | 0.41 | 0.41 |
| Boise St. | MWC | 1.87 | 1.87 | 72.41 | 72.41 | 0.84 | 0.84 |
| Seattle | WAC | 1.78 | 1.78 | 55.17 | 55.17 | 0.18 | 0.18 |
| DePaul | BE | 1.72 | 1.72 | 33.33 | 33.33 | -0.57 | -0.57 |
| Hartford | AE | 1.72 | 1.72 | 60.00 | 60.00 | 0.34 | 0.34 |
| North Carolina | ACC | 1.72 | 1.72 | 70.59 | 70.59 | 0.71 | 0.71 |
| Oklahoma | B12 | 1.72 | 1.72 | 56.67 | 56.67 | 0.23 | 0.23 |
| UC Riverside | BW | 0.31 | 0.31 | 24.14 | 24.14 | -0.16 | -0.16 |
| Nevada | MWC | 0.29 | 0.29 | 79.41 | 79.41 | 0.17 | 0.17 |
| UC Davis | BW | 0.28 | 0.28 | 66.67 | 66.67 | 0.09 | 0.09 |
| Utah St. | MWC | 0.28 | 0.28 | 48.48 | 48.48 | -0.01 | -0.01 |
| UC Santa Barbara | BW | 0.26 | 0.26 | 70.00 | 70.00 | 0.10 | 0.10 |
| San Diego St. | MWC | 0.25 | 0.25 | 67.74 | 67.74 | 0.09 | 0.09 |
| Eastern Washington | BSky | 0.23 | 0.23 | 56.25 | 56.25 | 0.03 | 0.03 |
| Idaho St. | BSky | 0.22 | 0.22 | 42.86 | 42.86 | -0.03 | -0.03 |
| Weber St. | BSky | 0.22 | 0.22 | 60.71 | 60.71 | 0.05 | 0.05 |
| Wyoming | MWC | 0.20 | 0.20 | 59.38 | 59.38 | 0.04 | 0.04 |
| Long Beach St. | BW | 0.20 | 0.20 | 41.94 | 41.94 | -0.03 | -0.03 |
| New Mexico St. | WAC | 0.20 | 0.20 | 83.33 | 83.33 | 0.13 | 0.13 |
| Cal Poly | BW | 0.17 | 0.17 | 24.14 | 24.14 | -0.09 | -0.09 |
| Cal St. Northridge | BW | 0.17 | 0.17 | 14.29 | 14.29 | -0.12 | -0.12 |
| Idaho | BSky | 0.17 | 0.17 | 68.97 | 68.97 | 0.07 | 0.07 |
| Northern Arizona | BSky | 0.17 | 0.17 | 13.33 | 13.33 | -0.13 | -0.13 |
| Air Force | MWC | 0.17 | 0.17 | 34.48 | 34.48 | -0.05 | -0.05 |
| UNLV | MWC | 0.17 | 0.17 | 60.61 | 60.61 | 0.04 | 0.04 |
| Southern Utah | BSky | 0.17 | 0.17 | 36.67 | 36.67 | -0.05 | -0.05 |
| Utah Valley | WAC | 0.17 | 0.17 | 65.52 | 65.52 | 0.05 | 0.05 |
| Washington | P12 | 0.17 | 0.17 | 62.50 | 62.50 | 0.04 | 0.04 |
| Stanford | P12 | 0.16 | 0.16 | 54.55 | 54.55 | 0.01 | 0.01 |
| Colorado St. | MWC | 0.15 | 0.15 | 32.26 | 32.26 | -0.05 | -0.05 |
| Grand Canyon | WAC | 0.14 | 0.14 | 65.62 | 65.62 | 0.04 | 0.04 |
| UC Irvine | BW | 0.14 | 0.14 | 48.48 | 48.48 | -0.00 | -0.00 |
| California | P12 | 0.14 | 0.14 | 25.81 | 25.81 | -0.07 | -0.07 |
| Oklahoma St. | B12 | 0.14 | 0.14 | 57.58 | 57.58 | 0.02 | 0.02 |
| Incarnate Word | Slnd | 0.14 | 0.14 | 12.50 | 12.50 | -0.10 | -0.10 |
| UT Arlington | SB | 0.14 | 0.14 | 60.61 | 60.61 | 0.03 | 0.03 |
| USC | P12 | 0.12 | 0.12 | 67.65 | 67.65 | 0.04 | 0.04 |
| New Mexico | MWC | 0.12 | 0.12 | 54.55 | 54.55 | 0.01 | 0.01 |
| Arkansas Pine Bluff | SWAC | 0.12 | 0.12 | 40.00 | 40.00 | -0.02 | -0.02 |
| Montana | BSky | 0.11 | 0.11 | 77.42 | 77.42 | 0.06 | 0.06 |
| Montana St. | BSky | 0.11 | 0.11 | 36.67 | 36.67 | -0.03 | -0.03 |
| Northern Colorado | BSky | 0.11 | 0.11 | 61.29 | 61.29 | 0.03 | 0.03 |
| Oregon | P12 | 0.11 | 0.11 | 64.71 | 64.71 | 0.03 | 0.03 |
| Arizona St. | P12 | 0.11 | 0.11 | 64.52 | 64.52 | 0.03 | 0.03 |
| North Dakota | BSky | 0.11 | 0.11 | 33.33 | 33.33 | -0.04 | -0.04 |
| Creighton | BE | 0.11 | 0.11 | 64.52 | 64.52 | 0.03 | 0.03 |
| Texas | B12 | 0.11 | 0.11 | 57.58 | 57.58 | 0.02 | 0.02 |
| Villanova | BE | 0.11 | 0.11 | 88.24 | 88.24 | 0.08 | 0.08 |
| St. Francis PA | NEC | 0.11 | 0.11 | 57.14 | 57.14 | 0.02 | 0.02 |
| Duke | ACC | 0.10 | 0.10 | 78.79 | 78.79 | 0.06 | 0.06 |
| Texas Southern | SWAC | 0.10 | 0.10 | 44.12 | 44.12 | -0.01 | -0.01 |
| McNeese St. | Slnd | 0.09 | 0.09 | 32.00 | 32.00 | -0.03 | -0.03 |
| Oregon St. | P12 | 0.09 | 0.09 | 50.00 | 50.00 | 0.00 | 0.00 |
| UT Rio Grande Valley | WAC | 0.09 | 0.09 | 43.33 | 43.33 | -0.01 | -0.01 |
| North Texas | CUSA | 0.09 | 0.09 | 43.33 | 43.33 | -0.01 | -0.01 |
| Belmont | OVC | 0.08 | 0.08 | 72.73 | 72.73 | 0.04 | 0.04 |
| Butler | BE | 0.08 | 0.08 | 60.61 | 60.61 | 0.02 | 0.02 |
| Iowa St. | B12 | 0.08 | 0.08 | 41.94 | 41.94 | -0.01 | -0.01 |
| Marquette | BE | 0.08 | 0.08 | 59.38 | 59.38 | 0.02 | 0.02 |
| New Hampshire | AE | 0.08 | 0.08 | 27.59 | 27.59 | -0.04 | -0.04 |
| UMBC | AE | 0.08 | 0.08 | 67.74 | 67.74 | 0.03 | 0.03 |
| Georgia | SEC | 0.08 | 0.08 | 54.55 | 54.55 | 0.01 | 0.01 |
| Harvard | Ivy | 0.08 | 0.08 | 56.67 | 56.67 | 0.01 | 0.01 |
| Washington St. | P12 | 0.08 | 0.08 | 38.71 | 38.71 | -0.02 | -0.02 |
| Illinois St. | MVC | 0.08 | 0.08 | 53.12 | 53.12 | 0.00 | 0.00 |
| Alabama | SEC | 0.08 | 0.08 | 55.88 | 55.88 | 0.01 | 0.01 |
| Notre Dame | ACC | 0.08 | 0.08 | 57.58 | 57.58 | 0.01 | 0.01 |
| Ohio St. | B10 | 0.08 | 0.08 | 75.00 | 75.00 | 0.04 | 0.04 |
| Hawaii | BW | 0.06 | 0.06 | 53.57 | 53.57 | 0.00 | 0.00 |
| Sam Houston St. | Slnd | 0.06 | 0.06 | 51.72 | 51.72 | 0.00 | 0.00 |
| Valparaiso | MVC | 0.06 | 0.06 | 43.33 | 43.33 | -0.01 | -0.01 |
| Fresno St. | MWC | 0.06 | 0.06 | 63.33 | 63.33 | 0.02 | 0.02 |
| Cal St. Bakersfield | WAC | 0.06 | 0.06 | 33.33 | 33.33 | -0.02 | -0.02 |
| Chicago St. | WAC | 0.06 | 0.06 | 3.33 | 3.33 | -0.05 | -0.05 |
| Colorado | P12 | 0.06 | 0.06 | 53.12 | 53.12 | 0.00 | 0.00 |
| Little Rock | SB | 0.06 | 0.06 | 20.00 | 20.00 | -0.03 | -0.03 |
| Norfolk St. | MEAC | 0.06 | 0.06 | 43.33 | 43.33 | -0.01 | -0.01 |
| Robert Morris | NEC | 0.06 | 0.06 | 48.48 | 48.48 | -0.00 | -0.00 |
| UMKC | WAC | 0.06 | 0.06 | 27.59 | 27.59 | -0.03 | -0.03 |
| Albany | AE | 0.06 | 0.06 | 67.74 | 67.74 | 0.02 | 0.02 |
| Baylor | B12 | 0.06 | 0.06 | 54.84 | 54.84 | 0.01 | 0.01 |
| Binghamton | AE | 0.06 | 0.06 | 31.03 | 31.03 | -0.02 | -0.02 |
| Canisius | MAAC | 0.06 | 0.06 | 65.62 | 65.62 | 0.02 | 0.02 |
| Central Connecticut | NEC | 0.06 | 0.06 | 43.75 | 43.75 | -0.01 | -0.01 |
| Georgetown | BE | 0.06 | 0.06 | 50.00 | 50.00 | 0.00 | 0.00 |
| Kansas | B12 | 0.06 | 0.06 | 79.41 | 79.41 | 0.03 | 0.03 |
| Kansas St. | B12 | 0.06 | 0.06 | 66.67 | 66.67 | 0.02 | 0.02 |
| LIU Brooklyn | NEC | 0.06 | 0.06 | 51.52 | 51.52 | 0.00 | 0.00 |
| Maine | AE | 0.06 | 0.06 | 13.33 | 13.33 | -0.04 | -0.04 |
| Miami OH | MAC | 0.06 | 0.06 | 45.16 | 45.16 | -0.01 | -0.01 |
| Northwestern | B10 | 0.06 | 0.06 | 45.16 | 45.16 | -0.01 | -0.01 |
| Oral Roberts | Sum | 0.06 | 0.06 | 28.57 | 28.57 | -0.02 | -0.02 |
| Providence | BE | 0.06 | 0.06 | 61.76 | 61.76 | 0.01 | 0.01 |
| Seton Hall | BE | 0.06 | 0.06 | 65.62 | 65.62 | 0.02 | 0.02 |
| St. John's | BE | 0.06 | 0.06 | 46.88 | 46.88 | -0.00 | -0.00 |
| Stony Brook | AE | 0.06 | 0.06 | 38.71 | 38.71 | -0.01 | -0.01 |
| TCU | B12 | 0.06 | 0.06 | 65.62 | 65.62 | 0.02 | 0.02 |
| Texas A&M | SEC | 0.06 | 0.06 | 62.50 | 62.50 | 0.01 | 0.01 |
| Texas St. | SB | 0.06 | 0.06 | 41.94 | 41.94 | -0.01 | -0.01 |
| Texas Tech | B12 | 0.06 | 0.06 | 72.73 | 72.73 | 0.03 | 0.03 |
| UMass Lowell | AE | 0.06 | 0.06 | 37.93 | 37.93 | -0.01 | -0.01 |
| Vermont | AE | 0.06 | 0.06 | 78.79 | 78.79 | 0.03 | 0.03 |
| West Virginia | B12 | 0.06 | 0.06 | 70.59 | 70.59 | 0.02 | 0.02 |
| Xavier | BE | 0.06 | 0.06 | 84.85 | 84.85 | 0.04 | 0.04 |
| Central Arkansas | Slnd | 0.05 | 0.05 | 50.00 | 50.00 | 0.00 | 0.00 |
| Duquesne | A10 | 0.05 | 0.05 | 50.00 | 50.00 | 0.00 | 0.00 |
| Radford | BSth | 0.05 | 0.05 | 62.50 | 62.50 | 0.01 | 0.01 |
| Arkansas | SEC | 0.05 | 0.05 | 67.65 | 67.65 | 0.02 | 0.02 |
| Boston College | ACC | 0.05 | 0.05 | 55.88 | 55.88 | 0.01 | 0.01 |
| Michigan St. | B10 | 0.05 | 0.05 | 87.88 | 87.88 | 0.04 | 0.04 |
| Dayton | A10 | 0.05 | 0.05 | 45.16 | 45.16 | -0.01 | -0.01 |
| UNC Asheville | BSth | 0.05 | 0.05 | 61.29 | 61.29 | 0.01 | 0.01 |
| Florida | SEC | 0.05 | 0.05 | 62.50 | 62.50 | 0.01 | 0.01 |
| Howard | MEAC | 0.05 | 0.05 | 25.81 | 25.81 | -0.02 | -0.02 |
| IUPUI | Horz | 0.05 | 0.05 | 32.14 | 32.14 | -0.02 | -0.02 |
| Massachusetts | A10 | 0.05 | 0.05 | 39.39 | 39.39 | -0.01 | -0.01 |
| Mississippi Valley St. | SWAC | 0.05 | 0.05 | 12.50 | 12.50 | -0.04 | -0.04 |
| Niagara | MAAC | 0.05 | 0.05 | 59.38 | 59.38 | 0.01 | 0.01 |
| Princeton | Ivy | 0.05 | 0.05 | 42.86 | 42.86 | -0.01 | -0.01 |
| Utah | P12 | 0.05 | 0.05 | 63.33 | 63.33 | 0.01 | 0.01 |
| Clemson | ACC | 0.05 | 0.05 | 71.88 | 71.88 | 0.02 | 0.02 |
| Miami FL | ACC | 0.05 | 0.05 | 70.97 | 70.97 | 0.02 | 0.02 |
| North Carolina St. | ACC | 0.05 | 0.05 | 65.62 | 65.62 | 0.02 | 0.02 |
| Syracuse | ACC | 0.05 | 0.05 | 60.61 | 60.61 | 0.01 | 0.01 |
| Virginia | ACC | 0.05 | 0.05 | 93.94 | 93.94 | 0.04 | 0.04 |
| Bowling Green | MAC | 0.03 | 0.03 | 46.67 | 46.67 | -0.00 | -0.00 |
| Denver | Sum | 0.03 | 0.03 | 46.43 | 46.43 | -0.00 | -0.00 |
| South Dakota | Sum | 0.03 | 0.03 | 73.33 | 73.33 | 0.01 | 0.01 |
| Southern Illinois | MVC | 0.03 | 0.03 | 59.38 | 59.38 | 0.01 | 0.01 |
| Detroit | Horz | 0.03 | 0.03 | 20.00 | 20.00 | -0.02 | -0.02 |
| Grambling St. | SWAC | 0.03 | 0.03 | 53.33 | 53.33 | 0.00 | 0.00 |
| Kennesaw St. | ASun | 0.03 | 0.03 | 28.57 | 28.57 | -0.01 | -0.01 |
| Loyola Chicago | MVC | 0.03 | 0.03 | 84.38 | 84.38 | 0.02 | 0.02 |
| Nicholls St. | Slnd | 0.03 | 0.03 | 60.71 | 60.71 | 0.01 | 0.01 |
| Saint Joseph's | A10 | 0.03 | 0.03 | 50.00 | 50.00 | 0.00 | 0.00 |
| Saint Louis | A10 | 0.03 | 0.03 | 50.00 | 50.00 | 0.00 | 0.00 |
| SMU | Amer | 0.03 | 0.03 | 51.52 | 51.52 | 0.00 | 0.00 |
| UTEP | CUSA | 0.03 | 0.03 | 33.33 | 33.33 | -0.01 | -0.01 |
| Alabama A&M | SWAC | 0.03 | 0.03 | 9.68 | 9.68 | -0.02 | -0.02 |
| Ball St. | MAC | 0.03 | 0.03 | 58.06 | 58.06 | 0.00 | 0.00 |
| Bryant | NEC | 0.03 | 0.03 | 9.68 | 9.68 | -0.02 | -0.02 |
| Delaware St. | MEAC | 0.03 | 0.03 | 6.67 | 6.67 | -0.02 | -0.02 |
| FIU | CUSA | 0.03 | 0.03 | 37.93 | 37.93 | -0.01 | -0.01 |
| Illinois | B10 | 0.03 | 0.03 | 41.94 | 41.94 | -0.00 | -0.00 |
| Illinois Chicago | Horz | 0.03 | 0.03 | 50.00 | 50.00 | 0.00 | 0.00 |
| Nebraska Omaha | Sum | 0.03 | 0.03 | 24.14 | 24.14 | -0.01 | -0.01 |
| Northwestern St. | Slnd | 0.03 | 0.03 | 8.00 | 8.00 | -0.02 | -0.02 |
| Quinnipiac | MAAC | 0.03 | 0.03 | 36.36 | 36.36 | -0.01 | -0.01 |
| Rider | MAAC | 0.03 | 0.03 | 70.97 | 70.97 | 0.01 | 0.01 |
| Rutgers | B10 | 0.03 | 0.03 | 42.42 | 42.42 | -0.00 | -0.00 |
| Sacred Heart | NEC | 0.03 | 0.03 | 30.00 | 30.00 | -0.01 | -0.01 |
| UTSA | CUSA | 0.03 | 0.03 | 53.33 | 53.33 | 0.00 | 0.00 |
| Wagner | NEC | 0.03 | 0.03 | 70.00 | 70.00 | 0.01 | 0.01 |
| Wichita St. | Amer | 0.03 | 0.03 | 78.12 | 78.12 | 0.02 | 0.02 |
| Youngstown St. | Horz | 0.03 | 0.03 | 20.00 | 20.00 | -0.02 | -0.02 |
| Bucknell | Pat | 0.02 | 0.02 | 73.53 | 73.53 | 0.01 | 0.01 |
| Davidson | A10 | 0.02 | 0.02 | 65.62 | 65.62 | 0.01 | 0.01 |
| Florida St. | ACC | 0.02 | 0.02 | 64.52 | 64.52 | 0.01 | 0.01 |
| Georgia Tech | ACC | 0.02 | 0.02 | 40.62 | 40.62 | -0.00 | -0.00 |
| Louisville | ACC | 0.02 | 0.02 | 60.61 | 60.61 | 0.01 | 0.01 |
| Michigan | B10 | 0.02 | 0.02 | 79.41 | 79.41 | 0.01 | 0.01 |
| Northern Iowa | MVC | 0.02 | 0.02 | 46.67 | 46.67 | -0.00 | -0.00 |
| Pittsburgh | ACC | 0.02 | 0.02 | 25.00 | 25.00 | -0.01 | -0.01 |
| Tennessee | SEC | 0.02 | 0.02 | 75.76 | 75.76 | 0.01 | 0.01 |
| Tulane | Amer | 0.02 | 0.02 | 45.16 | 45.16 | -0.00 | -0.00 |
| Virginia Tech | ACC | 0.02 | 0.02 | 65.62 | 65.62 | 0.01 | 0.01 |
| Wake Forest | ACC | 0.02 | 0.02 | 35.48 | 35.48 | -0.01 | -0.01 |
| Western Carolina | SC | 0.02 | 0.02 | 36.67 | 36.67 | -0.01 | -0.01 |
| Wofford | SC | 0.02 | 0.02 | 60.00 | 60.00 | 0.00 | 0.00 |