
 - Blog
| Conference: | Sum |
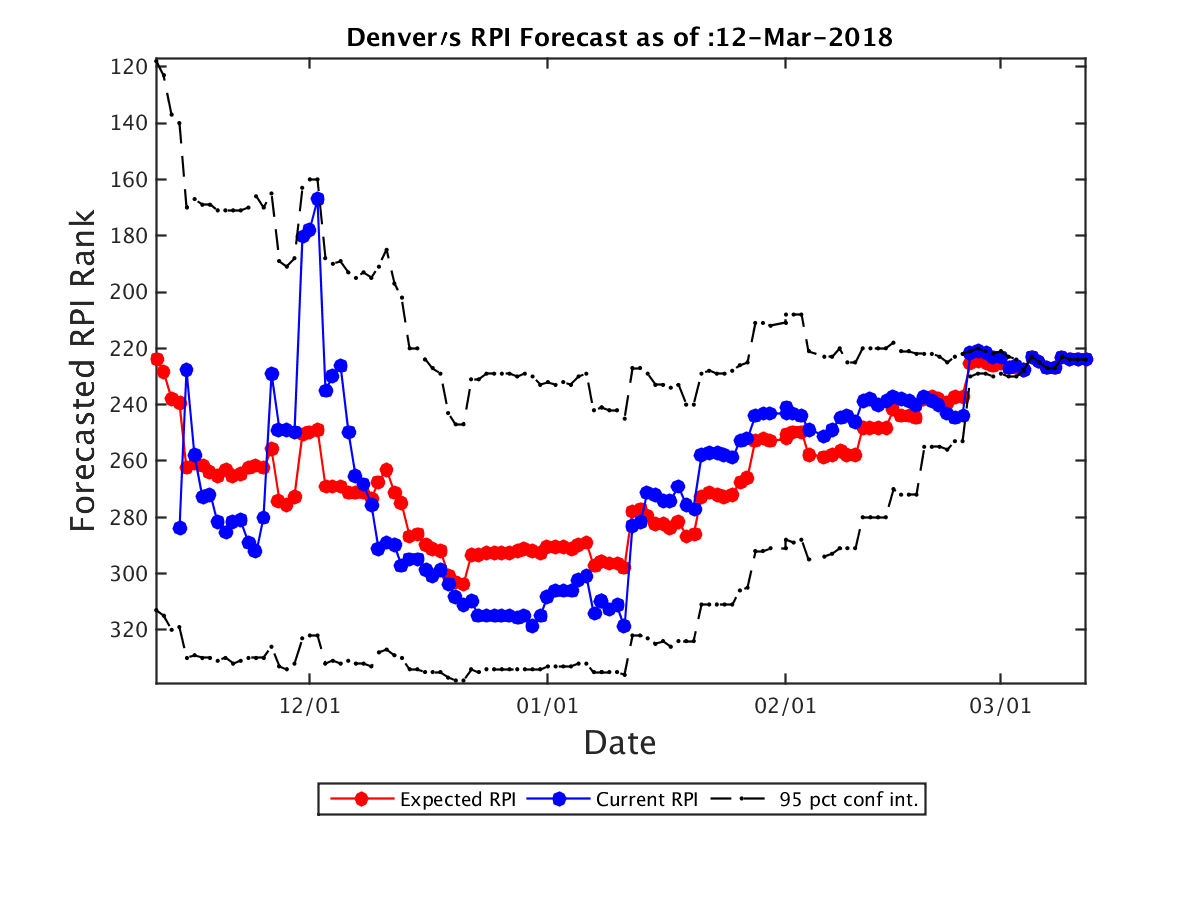
| Expected RPI: | 224.0 |
| Current RPI: | 224 |
| Expected SOS: | 231 |
| Current SOS: | 231 |
| Current Record: | 13-15 |
| Expected Record: | 13-15 |
| Current Conf Record: | 9-7 |
| Expected Conf Record: | 9-7 |
| Expected Record vs RPI 1-25: | 0-0 |
| Expected Record vs RPI 26-50: | 0-2 |
| Expected Record vs RPI 51-100: | 2-4 |
| Expected Record vs RPI 101-200: | 0-4 |
| Expected Record vs RPI 200+: | 11-5 |
| Current OOC Record: | 4-8 |
| Expected OOC Record: | 4-8 |
| Expected OOC RPI: | 299 |
| Expected OOC SOS: | 290 |
| Final Record | Expected RPI | Probability |
|---|---|---|
| 13-15 | 224.0 | 100.00% |
| Date | Opponent (Expected RPI) | Conf | Location | Score | Outcome | Prob(W) | Spread |
|---|---|---|---|---|---|---|---|
| 11-12 | UC Irvine (119.0) | BW | H | 69-83 | L | 0% | 0.0 |
| 11-14 | Colorado (82.0) | P12 | A | 89-62 | L | 0% | 0.0 |
| 11-24 | Florida Gulf Coast (172.0) | ASun | A | 79-71 | L | 0% | 0.0 |
| 11-25 | St. Francis NY (276.0) | NEC | N | 50-60 | W | 100% | 0.0 |
| 11-26 | Navy (200.0) | Pat | N | 71-79 | L | 0% | 0.0 |
| 11-29 | Wyoming (98.0) | MWC | H | 88-78 | W | 100% | 0.0 |
| 12-2 | Air Force (253.0) | MWC | H | 59-61 | L | 0% | 0.0 |
| 12-5 | San Jose St. (314.0) | MWC | H | 58-56 | W | 100% | 0.0 |
| 12-9 | USC Upstate (344.0) | ASun | H | 84-69 | W | 100% | 0.0 |
| 12-13 | Northern Colorado (110.0) | BSky | A | 83-63 | L | 0% | 0.0 |
| 12-15 | Stanford (86.0) | P12 | A | 75-62 | L | 0% | 0.0 |
| 12-18 | Montana St. (283.0) | BSky | A | 79-65 | L | 0% | 0.0 |
| 12-30 | South Dakota (91.0) | Sum | A | 82-71 | L | 0% | 0.0 |
| 1-6 | Fort Wayne (209.0) | Sum | H | 63-82 | L | 0% | 0.0 |
| 1-11 | North Dakota St. (210.0) | Sum | A | 61-67 | W | 100% | 0.0 |
| 1-13 | South Dakota St. (37.0) | Sum | A | 94-72 | L | 0% | 0.0 |
| 1-18 | Nebraska Omaha (284.0) | Sum | A | 86-80 | L | 0% | 0.0 |
| 1-20 | Oral Roberts (255.0) | Sum | A | 64-73 | W | 100% | 0.0 |
| 1-25 | Western Illinois (302.0) | Sum | H | 70-58 | W | 100% | 0.0 |
| 1-27 | South Dakota (91.0) | Sum | H | 84-68 | W | 100% | 0.0 |
| 2-3 | Fort Wayne (209.0) | Sum | A | 91-63 | L | 0% | 0.0 |
| 2-8 | South Dakota St. (37.0) | Sum | H | 77-81 | L | 0% | 0.0 |
| 2-10 | North Dakota St. (210.0) | Sum | H | 66-63 | W | 100% | 0.0 |
| 2-14 | Nebraska Omaha (284.0) | Sum | H | 94-78 | W | 100% | 0.0 |
| 2-18 | Oral Roberts (255.0) | Sum | H | 66-65 | W | 100% | 0.0 |
| 2-24 | Western Illinois (302.0) | Sum | A | 52-89 | W | 100% | 0.0 |
| 3-4 | Oral Roberts (255.0) | Sum | N | 90-88 | W | 100% | 0.0 |
| 3-5 | South Dakota (91.0) | Sum | N | 76-58 | L | 0% | 0.0 |
| Team | Conf | Curr Wgt | Fut Wgt | Curr W/L | Exp W/L | Curr Impact | Exp Impact |
|---|---|---|---|---|---|---|---|
| Denver | Sum | 26.55 | 26.55 | 45.83 | 45.83 | -2.21 | -2.21 |
| South Dakota | Sum | 6.37 | 6.37 | 74.07 | 74.07 | 3.07 | 3.07 |
| Oral Roberts | Sum | 6.21 | 6.21 | 32.00 | 32.00 | -2.23 | -2.23 |
| South Dakota St. | Sum | 4.77 | 4.77 | 78.57 | 78.57 | 2.73 | 2.73 |
| Nebraska Omaha | Sum | 4.61 | 4.61 | 22.22 | 22.22 | -2.56 | -2.56 |
| North Dakota St. | Sum | 4.58 | 4.58 | 44.44 | 44.44 | -0.51 | -0.51 |
| Fort Wayne | Sum | 4.52 | 4.52 | 46.15 | 46.15 | -0.35 | -0.35 |
| Western Illinois | Sum | 4.49 | 4.49 | 36.36 | 36.36 | -1.23 | -1.23 |
| Florida Gulf Coast | ASun | 2.04 | 2.04 | 63.33 | 63.33 | 0.54 | 0.54 |
| San Jose St. | MWC | 2.02 | 2.02 | 10.71 | 10.71 | -1.59 | -1.59 |
| Wyoming | MWC | 2.00 | 2.00 | 61.29 | 61.29 | 0.45 | 0.45 |
| Northern Colorado | BSky | 1.99 | 1.99 | 60.00 | 60.00 | 0.40 | 0.40 |
| Montana St. | BSky | 1.97 | 1.97 | 34.48 | 34.48 | -0.61 | -0.61 |
| Colorado | P12 | 1.93 | 1.93 | 51.61 | 51.61 | 0.06 | 0.06 |
| Air Force | MWC | 1.90 | 1.90 | 32.14 | 32.14 | -0.68 | -0.68 |
| USC Upstate | ASun | 1.87 | 1.87 | 11.11 | 11.11 | -1.46 | -1.46 |
| Navy | Pat | 1.85 | 1.85 | 60.00 | 60.00 | 0.37 | 0.37 |
| UC Irvine | BW | 1.85 | 1.85 | 46.88 | 46.88 | -0.12 | -0.12 |
| St. Francis NY | NEC | 1.84 | 1.84 | 39.29 | 39.29 | -0.39 | -0.39 |
| Stanford | P12 | 1.81 | 1.81 | 53.12 | 53.12 | 0.11 | 0.11 |
| North Dakota | BSky | 0.33 | 0.33 | 33.33 | 33.33 | -0.11 | -0.11 |
| Drake | MVC | 0.33 | 0.33 | 48.39 | 48.39 | -0.01 | -0.01 |
| UNLV | MWC | 0.31 | 0.31 | 60.61 | 60.61 | 0.06 | 0.06 |
| New Mexico | MWC | 0.30 | 0.30 | 54.55 | 54.55 | 0.03 | 0.03 |
| Montana | BSky | 0.30 | 0.30 | 77.42 | 77.42 | 0.16 | 0.16 |
| Missouri St. | MVC | 0.28 | 0.28 | 53.12 | 53.12 | 0.02 | 0.02 |
| UCLA | P12 | 0.25 | 0.25 | 65.62 | 65.62 | 0.08 | 0.08 |
| Stetson | ASun | 0.25 | 0.25 | 28.57 | 28.57 | -0.11 | -0.11 |
| Utah St. | MWC | 0.24 | 0.24 | 48.48 | 48.48 | -0.01 | -0.01 |
| UC Santa Barbara | BW | 0.23 | 0.23 | 70.00 | 70.00 | 0.09 | 0.09 |
| Northern Arizona | BSky | 0.23 | 0.23 | 13.33 | 13.33 | -0.17 | -0.17 |
| Eastern Washington | BSky | 0.23 | 0.23 | 56.25 | 56.25 | 0.03 | 0.03 |
| Colorado St. | MWC | 0.21 | 0.21 | 32.26 | 32.26 | -0.07 | -0.07 |
| Arizona | P12 | 0.20 | 0.20 | 79.41 | 79.41 | 0.12 | 0.12 |
| Bowling Green | MAC | 0.18 | 0.18 | 46.67 | 46.67 | -0.01 | -0.01 |
| UMKC | WAC | 0.18 | 0.18 | 27.59 | 27.59 | -0.08 | -0.08 |
| Lipscomb | ASun | 0.18 | 0.18 | 68.97 | 68.97 | 0.07 | 0.07 |
| San Diego St. | MWC | 0.18 | 0.18 | 67.74 | 67.74 | 0.06 | 0.06 |
| Fresno St. | MWC | 0.18 | 0.18 | 63.33 | 63.33 | 0.05 | 0.05 |
| Nevada | MWC | 0.18 | 0.18 | 79.41 | 79.41 | 0.10 | 0.10 |
| USC | P12 | 0.17 | 0.17 | 67.65 | 67.65 | 0.06 | 0.06 |
| Washington | P12 | 0.17 | 0.17 | 62.50 | 62.50 | 0.04 | 0.04 |
| Arizona St. | P12 | 0.16 | 0.16 | 64.52 | 64.52 | 0.05 | 0.05 |
| Oakland | Horz | 0.16 | 0.16 | 57.58 | 57.58 | 0.02 | 0.02 |
| Kansas St. | B12 | 0.15 | 0.15 | 66.67 | 66.67 | 0.05 | 0.05 |
| TCU | B12 | 0.15 | 0.15 | 65.62 | 65.62 | 0.05 | 0.05 |
| North Florida | ASun | 0.15 | 0.15 | 36.67 | 36.67 | -0.04 | -0.04 |
| Eastern Illinois | OVC | 0.15 | 0.15 | 34.48 | 34.48 | -0.05 | -0.05 |
| Boise St. | MWC | 0.15 | 0.15 | 73.33 | 73.33 | 0.07 | 0.07 |
| Kansas | B12 | 0.15 | 0.15 | 79.41 | 79.41 | 0.09 | 0.09 |
| Miami OH | MAC | 0.14 | 0.14 | 45.16 | 45.16 | -0.01 | -0.01 |
| SIU Edwardsville | OVC | 0.14 | 0.14 | 30.00 | 30.00 | -0.06 | -0.06 |
| American | Pat | 0.13 | 0.13 | 20.00 | 20.00 | -0.08 | -0.08 |
| Minnesota | B10 | 0.13 | 0.13 | 46.88 | 46.88 | -0.01 | -0.01 |
| Pepperdine | WCC | 0.12 | 0.12 | 16.13 | 16.13 | -0.08 | -0.08 |
| Jacksonville | ASun | 0.12 | 0.12 | 37.93 | 37.93 | -0.03 | -0.03 |
| Kennesaw St. | ASun | 0.12 | 0.12 | 28.57 | 28.57 | -0.05 | -0.05 |
| NJIT | ASun | 0.12 | 0.12 | 42.86 | 42.86 | -0.02 | -0.02 |
| Army | Pat | 0.12 | 0.12 | 41.38 | 41.38 | -0.02 | -0.02 |
| Southern Utah | BSky | 0.12 | 0.12 | 36.67 | 36.67 | -0.03 | -0.03 |
| Idaho St. | BSky | 0.12 | 0.12 | 42.86 | 42.86 | -0.02 | -0.02 |
| Southern Miss | CUSA | 0.12 | 0.12 | 40.00 | 40.00 | -0.02 | -0.02 |
| Youngstown St. | Horz | 0.12 | 0.12 | 20.00 | 20.00 | -0.07 | -0.07 |
| Weber St. | BSky | 0.12 | 0.12 | 60.71 | 60.71 | 0.02 | 0.02 |
| Portland St. | BSky | 0.12 | 0.12 | 56.67 | 56.67 | 0.02 | 0.02 |
| Idaho | BSky | 0.11 | 0.11 | 68.97 | 68.97 | 0.04 | 0.04 |
| UC Davis | BW | 0.11 | 0.11 | 66.67 | 66.67 | 0.04 | 0.04 |
| Washington St. | P12 | 0.11 | 0.11 | 38.71 | 38.71 | -0.02 | -0.02 |
| California | P12 | 0.11 | 0.11 | 25.81 | 25.81 | -0.05 | -0.05 |
| Milwaukee | Horz | 0.10 | 0.10 | 48.39 | 48.39 | -0.00 | -0.00 |
| Arkansas | SEC | 0.10 | 0.10 | 67.65 | 67.65 | 0.03 | 0.03 |
| Little Rock | SB | 0.10 | 0.10 | 20.00 | 20.00 | -0.06 | -0.06 |
| Oklahoma St. | B12 | 0.10 | 0.10 | 57.58 | 57.58 | 0.01 | 0.01 |
| Penn St. | B10 | 0.10 | 0.10 | 61.76 | 61.76 | 0.02 | 0.02 |
| Tulsa | Amer | 0.10 | 0.10 | 61.29 | 61.29 | 0.02 | 0.02 |
| Louisiana Tech | CUSA | 0.09 | 0.09 | 48.39 | 48.39 | -0.00 | -0.00 |
| LIU Brooklyn | NEC | 0.09 | 0.09 | 51.52 | 51.52 | 0.00 | 0.00 |
| Bryant | NEC | 0.09 | 0.09 | 9.68 | 9.68 | -0.07 | -0.07 |
| Duke | ACC | 0.09 | 0.09 | 78.79 | 78.79 | 0.05 | 0.05 |
| Grambling St. | SWAC | 0.09 | 0.09 | 53.33 | 53.33 | 0.01 | 0.01 |
| Sacramento St. | BSky | 0.09 | 0.09 | 16.67 | 16.67 | -0.06 | -0.06 |
| Wichita St. | Amer | 0.09 | 0.09 | 78.12 | 78.12 | 0.05 | 0.05 |
| Iowa | B10 | 0.09 | 0.09 | 42.42 | 42.42 | -0.01 | -0.01 |
| Holy Cross | Pat | 0.09 | 0.09 | 38.71 | 38.71 | -0.02 | -0.02 |
| Pacific | WCC | 0.09 | 0.09 | 41.94 | 41.94 | -0.01 | -0.01 |
| UC Riverside | BW | 0.08 | 0.08 | 24.14 | 24.14 | -0.04 | -0.04 |
| Oregon St. | P12 | 0.08 | 0.08 | 50.00 | 50.00 | 0.00 | 0.00 |
| Utah | P12 | 0.08 | 0.08 | 63.33 | 63.33 | 0.02 | 0.02 |
| Cal Poly | BW | 0.08 | 0.08 | 24.14 | 24.14 | -0.04 | -0.04 |
| Cal St. Fullerton | BW | 0.08 | 0.08 | 62.07 | 62.07 | 0.02 | 0.02 |
| Hawaii | BW | 0.08 | 0.08 | 53.57 | 53.57 | 0.01 | 0.01 |
| Long Beach St. | BW | 0.08 | 0.08 | 41.94 | 41.94 | -0.01 | -0.01 |
| Butler | BE | 0.07 | 0.07 | 60.61 | 60.61 | 0.02 | 0.02 |
| Iowa St. | B12 | 0.07 | 0.07 | 41.94 | 41.94 | -0.01 | -0.01 |
| IUPUI | Horz | 0.07 | 0.07 | 32.14 | 32.14 | -0.03 | -0.03 |
| Akron | MAC | 0.06 | 0.06 | 41.94 | 41.94 | -0.01 | -0.01 |
| Delaware St. | MEAC | 0.06 | 0.06 | 6.67 | 6.67 | -0.06 | -0.06 |
| Detroit | Horz | 0.06 | 0.06 | 20.00 | 20.00 | -0.04 | -0.04 |
| East Tennessee St. | SC | 0.06 | 0.06 | 71.88 | 71.88 | 0.03 | 0.03 |
| Illinois Chicago | Horz | 0.06 | 0.06 | 50.00 | 50.00 | 0.00 | 0.00 |
| Indiana | B10 | 0.06 | 0.06 | 51.61 | 51.61 | 0.00 | 0.00 |
| Kentucky | SEC | 0.06 | 0.06 | 70.59 | 70.59 | 0.03 | 0.03 |
| Liberty | BSth | 0.06 | 0.06 | 54.84 | 54.84 | 0.01 | 0.01 |
| Abilene Christian | Slnd | 0.06 | 0.06 | 44.44 | 44.44 | -0.01 | -0.01 |
| Arkansas St. | SB | 0.06 | 0.06 | 30.00 | 30.00 | -0.02 | -0.02 |
| Central Connecticut | NEC | 0.06 | 0.06 | 43.75 | 43.75 | -0.01 | -0.01 |
| Fairleigh Dickinson | NEC | 0.06 | 0.06 | 37.93 | 37.93 | -0.01 | -0.01 |
| Florida A&M | MEAC | 0.06 | 0.06 | 24.24 | 24.24 | -0.03 | -0.03 |
| Jackson St. | SWAC | 0.06 | 0.06 | 33.33 | 33.33 | -0.02 | -0.02 |
| Louisville | ACC | 0.06 | 0.06 | 60.61 | 60.61 | 0.01 | 0.01 |
| Mississippi St. | SEC | 0.06 | 0.06 | 65.62 | 65.62 | 0.02 | 0.02 |
| Mount St. Mary's | NEC | 0.06 | 0.06 | 53.33 | 53.33 | 0.00 | 0.00 |
| Oklahoma | B12 | 0.06 | 0.06 | 58.06 | 58.06 | 0.01 | 0.01 |
| Robert Morris | NEC | 0.06 | 0.06 | 48.48 | 48.48 | -0.00 | -0.00 |
| Sacred Heart | NEC | 0.06 | 0.06 | 30.00 | 30.00 | -0.02 | -0.02 |
| St. Francis PA | NEC | 0.06 | 0.06 | 57.14 | 57.14 | 0.01 | 0.01 |
| Stephen F. Austin | Slnd | 0.06 | 0.06 | 80.00 | 80.00 | 0.04 | 0.04 |
| Tennessee Tech | OVC | 0.06 | 0.06 | 54.84 | 54.84 | 0.01 | 0.01 |
| UNC Wilmington | CAA | 0.06 | 0.06 | 30.00 | 30.00 | -0.02 | -0.02 |
| UTEP | CUSA | 0.06 | 0.06 | 33.33 | 33.33 | -0.02 | -0.02 |
| Wagner | NEC | 0.06 | 0.06 | 70.00 | 70.00 | 0.02 | 0.02 |
| Alabama St. | SWAC | 0.06 | 0.06 | 25.81 | 25.81 | -0.03 | -0.03 |
| Buffalo | MAC | 0.06 | 0.06 | 75.76 | 75.76 | 0.03 | 0.03 |
| Mississippi | SEC | 0.06 | 0.06 | 37.50 | 37.50 | -0.01 | -0.01 |
| San Diego | WCC | 0.06 | 0.06 | 56.67 | 56.67 | 0.01 | 0.01 |
| Saint Mary's | WCC | 0.06 | 0.06 | 84.85 | 84.85 | 0.04 | 0.04 |
| Boston University | Pat | 0.06 | 0.06 | 46.67 | 46.67 | -0.00 | -0.00 |
| Bucknell | Pat | 0.06 | 0.06 | 73.53 | 73.53 | 0.03 | 0.03 |
| Colgate | Pat | 0.06 | 0.06 | 58.06 | 58.06 | 0.01 | 0.01 |
| Lafayette | Pat | 0.06 | 0.06 | 30.00 | 30.00 | -0.02 | -0.02 |
| Lehigh | Pat | 0.06 | 0.06 | 51.72 | 51.72 | 0.00 | 0.00 |
| Loyola MD | Pat | 0.06 | 0.06 | 26.67 | 26.67 | -0.03 | -0.03 |
| Middle Tennessee | CUSA | 0.06 | 0.06 | 76.67 | 76.67 | 0.03 | 0.03 |
| Oregon | P12 | 0.05 | 0.05 | 64.71 | 64.71 | 0.02 | 0.02 |
| Cal St. Northridge | BW | 0.05 | 0.05 | 14.29 | 14.29 | -0.04 | -0.04 |
| Campbell | BSth | 0.03 | 0.03 | 46.43 | 46.43 | -0.00 | -0.00 |
| Charleston Southern | BSth | 0.03 | 0.03 | 42.86 | 42.86 | -0.00 | -0.00 |
| Creighton | BE | 0.03 | 0.03 | 64.52 | 64.52 | 0.01 | 0.01 |
| Gardner Webb | BSth | 0.03 | 0.03 | 37.93 | 37.93 | -0.01 | -0.01 |
| Georgia | SEC | 0.03 | 0.03 | 54.55 | 54.55 | 0.00 | 0.00 |
| Jacksonville St. | OVC | 0.03 | 0.03 | 62.50 | 62.50 | 0.01 | 0.01 |
| UNC Asheville | BSth | 0.03 | 0.03 | 61.29 | 61.29 | 0.01 | 0.01 |
| Arkansas Pine Bluff | SWAC | 0.03 | 0.03 | 40.00 | 40.00 | -0.01 | -0.01 |
| Brown | Ivy | 0.03 | 0.03 | 38.46 | 38.46 | -0.01 | -0.01 |
| Canisius | MAAC | 0.03 | 0.03 | 65.62 | 65.62 | 0.01 | 0.01 |
| Duquesne | A10 | 0.03 | 0.03 | 50.00 | 50.00 | 0.00 | 0.00 |
| Fordham | A10 | 0.03 | 0.03 | 29.03 | 29.03 | -0.01 | -0.01 |
| Indiana St. | MVC | 0.03 | 0.03 | 37.93 | 37.93 | -0.01 | -0.01 |
| Manhattan | MAAC | 0.03 | 0.03 | 45.16 | 45.16 | -0.00 | -0.00 |
| Notre Dame | ACC | 0.03 | 0.03 | 57.58 | 57.58 | 0.00 | 0.00 |
| Portland | WCC | 0.03 | 0.03 | 24.14 | 24.14 | -0.02 | -0.02 |
| Saint Peter's | MAAC | 0.03 | 0.03 | 43.75 | 43.75 | -0.00 | -0.00 |
| Santa Clara | WCC | 0.03 | 0.03 | 34.48 | 34.48 | -0.01 | -0.01 |
| Southern Illinois | MVC | 0.03 | 0.03 | 59.38 | 59.38 | 0.01 | 0.01 |
| Texas St. | SB | 0.03 | 0.03 | 41.94 | 41.94 | -0.00 | -0.00 |
| Binghamton | AE | 0.03 | 0.03 | 31.03 | 31.03 | -0.01 | -0.01 |
| Central Michigan | MAC | 0.03 | 0.03 | 53.33 | 53.33 | 0.00 | 0.00 |
| Southeast Missouri St. | OVC | 0.03 | 0.03 | 41.38 | 41.38 | -0.01 | -0.01 |
| Columbia | Ivy | 0.03 | 0.03 | 26.92 | 26.92 | -0.01 | -0.01 |
| Coppin St. | MEAC | 0.03 | 0.03 | 15.62 | 15.62 | -0.02 | -0.02 |
| Delaware | CAA | 0.03 | 0.03 | 38.71 | 38.71 | -0.01 | -0.01 |
| FIU | CUSA | 0.03 | 0.03 | 37.93 | 37.93 | -0.01 | -0.01 |
| Florida Atlantic | CUSA | 0.03 | 0.03 | 32.14 | 32.14 | -0.01 | -0.01 |
| Illinois St. | MVC | 0.03 | 0.03 | 53.12 | 53.12 | 0.00 | 0.00 |
| Miami FL | ACC | 0.03 | 0.03 | 70.97 | 70.97 | 0.01 | 0.01 |
| Morgan St. | MEAC | 0.03 | 0.03 | 36.67 | 36.67 | -0.01 | -0.01 |
| Penn | Ivy | 0.03 | 0.03 | 74.19 | 74.19 | 0.01 | 0.01 |
| Pittsburgh | ACC | 0.03 | 0.03 | 25.00 | 25.00 | -0.01 | -0.01 |
| Rhode Island | A10 | 0.03 | 0.03 | 78.12 | 78.12 | 0.02 | 0.02 |
| Siena | MAAC | 0.03 | 0.03 | 25.00 | 25.00 | -0.01 | -0.01 |
| UT Arlington | SB | 0.03 | 0.03 | 60.61 | 60.61 | 0.01 | 0.01 |
| Chattanooga | SC | 0.03 | 0.03 | 25.81 | 25.81 | -0.01 | -0.01 |
| Cincinnati | Amer | 0.03 | 0.03 | 88.24 | 88.24 | 0.02 | 0.02 |
| Louisiana Lafayette | SB | 0.03 | 0.03 | 80.65 | 80.65 | 0.02 | 0.02 |
| Mercer | SC | 0.03 | 0.03 | 53.33 | 53.33 | 0.00 | 0.00 |
| Quinnipiac | MAAC | 0.03 | 0.03 | 36.36 | 36.36 | -0.01 | -0.01 |
| South Carolina | SEC | 0.03 | 0.03 | 50.00 | 50.00 | 0.00 | 0.00 |
| Texas Southern | SWAC | 0.03 | 0.03 | 44.12 | 44.12 | -0.00 | -0.00 |
| Xavier | BE | 0.03 | 0.03 | 84.85 | 84.85 | 0.02 | 0.02 |
| Florida | SEC | 0.03 | 0.03 | 62.50 | 62.50 | 0.01 | 0.01 |
| New Mexico St. | WAC | 0.03 | 0.03 | 83.33 | 83.33 | 0.02 | 0.02 |
| North Carolina | ACC | 0.03 | 0.03 | 71.43 | 71.43 | 0.01 | 0.01 |
| Northeastern | CAA | 0.03 | 0.03 | 68.75 | 68.75 | 0.01 | 0.01 |
| Ohio St. | B10 | 0.03 | 0.03 | 75.00 | 75.00 | 0.01 | 0.01 |
| Rider | MAAC | 0.03 | 0.03 | 70.97 | 70.97 | 0.01 | 0.01 |
| San Francisco | WCC | 0.03 | 0.03 | 53.12 | 53.12 | 0.00 | 0.00 |
| UT Rio Grande Valley | WAC | 0.03 | 0.03 | 43.33 | 43.33 | -0.00 | -0.00 |