
 - Blog
| Conference: | P12 |
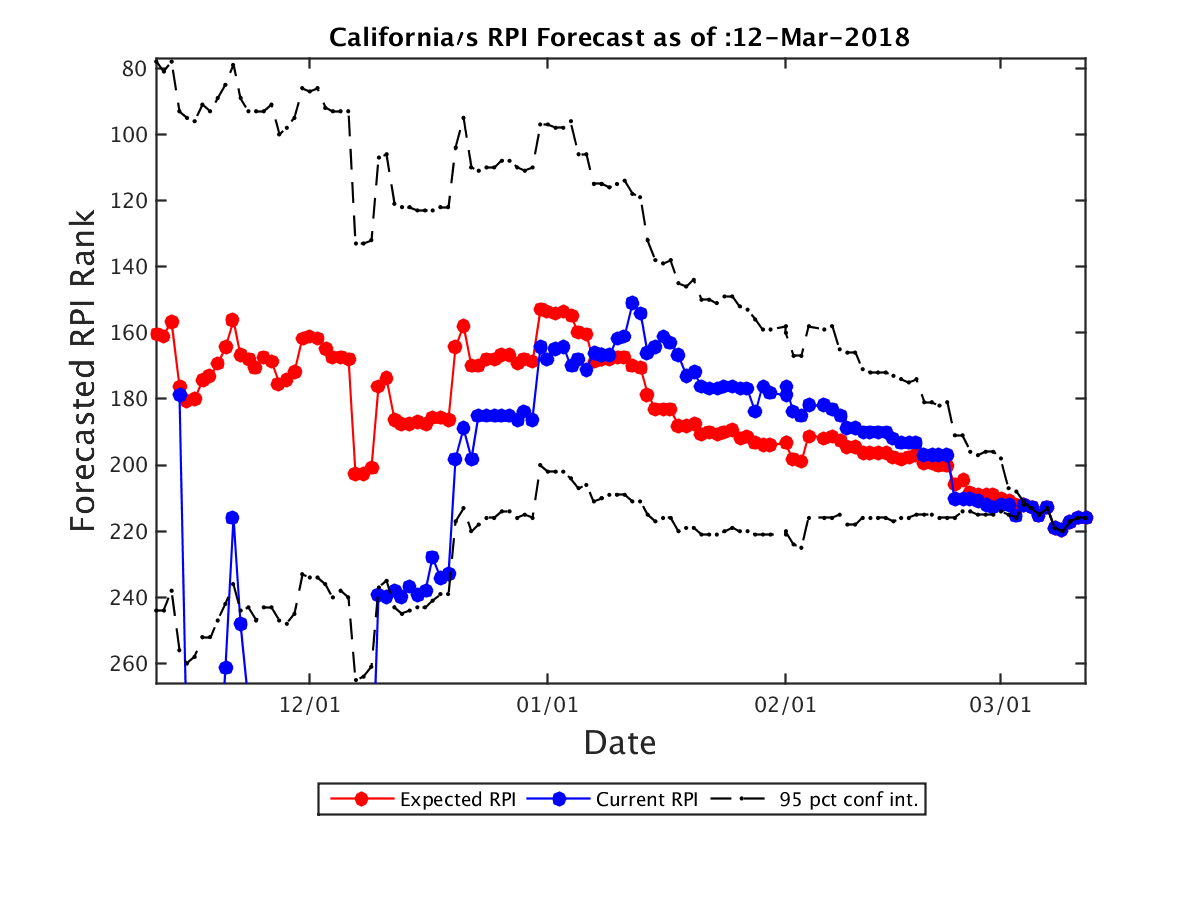
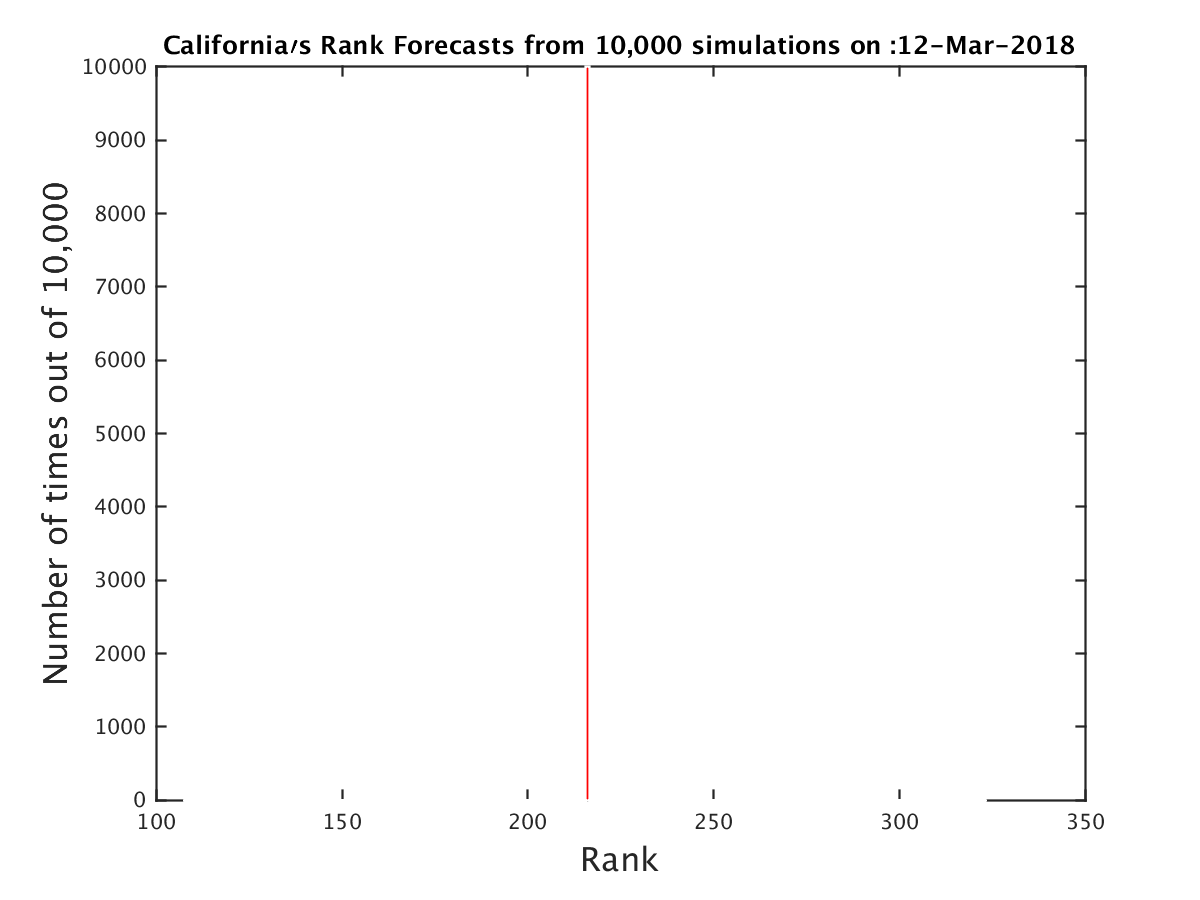
| Expected RPI: | 216.0 |
| Current RPI: | 216 |
| Expected SOS: | 58 |
| Current SOS: | 58 |
| Current Record: | 8-23 |
| Expected Record: | 8-23 |
| Current Conf Record: | 2-17 |
| Expected Conf Record: | 2-17 |
| Expected Record vs RPI 1-25: | 0-3 |
| Expected Record vs RPI 26-50: | 0-5 |
| Expected Record vs RPI 51-100: | 2-9 |
| Expected Record vs RPI 101-200: | 4-4 |
| Expected Record vs RPI 200+: | 2-2 |
| Current OOC Record: | 6-6 |
| Expected OOC Record: | 6-6 |
| Expected OOC RPI: | 191 |
| Expected OOC SOS: | 127 |
| Final Record | Expected RPI | Probability |
|---|---|---|
| 8-23 | 216.0 | 100.00% |
| Date | Opponent (Expected RPI) | Conf | Location | Score | Outcome | Prob(W) | Spread |
|---|---|---|---|---|---|---|---|
| 11-10 | UC Riverside (300.0) | BW | H | 66-74 | L | 0% | 0.0 |
| 11-12 | Cal Poly (305.0) | BW | H | 85-82 | W | 100% | 0.0 |
| 11-16 | Wofford (129.0) | SC | H | 79-65 | W | 100% | 0.0 |
| 11-20 | Wichita St. (16.0) | Amer | N | 82-92 | L | 0% | 0.0 |
| 11-21 | VCU (135.0) | A10 | N | 69-83 | L | 0% | 0.0 |
| 11-28 | Cal St. Northridge (340.0) | BW | H | 83-63 | W | 100% | 0.0 |
| 12-2 | Saint Mary's (40.0) | WCC | H | 63-74 | L | 0% | 0.0 |
| 12-6 | Central Arkansas (223.0) | Slnd | H | 69-96 | L | 0% | 0.0 |
| 12-9 | San Diego St. (62.0) | MWC | A | 62-63 | W | 100% | 0.0 |
| 12-16 | Cal St. Fullerton (131.0) | BW | H | 95-89 | W | 100% | 0.0 |
| 12-19 | Seattle (165.0) | WAC | A | 59-81 | W | 100% | 0.0 |
| 12-21 | Portland St. (170.0) | BSky | H | 81-106 | L | 0% | 0.0 |
| 12-30 | Stanford (86.0) | P12 | A | 74-77 | W | 100% | 0.0 |
| 1-4 | USC (34.0) | P12 | H | 62-80 | L | 0% | 0.0 |
| 1-6 | UCLA (36.0) | P12 | H | 84-107 | L | 0% | 0.0 |
| 1-11 | Washington (71.0) | P12 | A | 66-56 | L | 0% | 0.0 |
| 1-13 | Washington St. (179.0) | P12 | A | 78-53 | L | 0% | 0.0 |
| 1-17 | Arizona (13.0) | P12 | H | 58-79 | L | 0% | 0.0 |
| 1-20 | Arizona St. (66.0) | P12 | H | 73-81 | L | 0% | 0.0 |
| 1-25 | UCLA (36.0) | P12 | A | 70-57 | L | 0% | 0.0 |
| 1-28 | USC (34.0) | P12 | A | 77-59 | L | 0% | 0.0 |
| 2-1 | Oregon (72.0) | P12 | H | 53-66 | L | 0% | 0.0 |
| 2-3 | Oregon St. (137.0) | P12 | H | 74-70 | W | 100% | 0.0 |
| 2-7 | Colorado (82.0) | P12 | A | 68-64 | L | 0% | 0.0 |
| 2-10 | Utah (59.0) | P12 | A | 77-43 | L | 0% | 0.0 |
| 2-18 | Stanford (86.0) | P12 | H | 73-77 | L | 0% | 0.0 |
| 2-22 | Washington St. (179.0) | P12 | H | 76-78 | L | 0% | 0.0 |
| 2-24 | Washington (71.0) | P12 | H | 51-68 | L | 0% | 0.0 |
| 3-1 | Arizona St. (66.0) | P12 | A | 84-53 | L | 0% | 0.0 |
| 3-3 | Arizona (13.0) | P12 | A | 66-54 | L | 0% | 0.0 |
| 3-7 | Stanford (86.0) | P12 | N | 76-58 | L | 0% | 0.0 |
| Team | Conf | Curr Wgt | Fut Wgt | Curr W/L | Exp W/L | Curr Impact | Exp Impact |
|---|---|---|---|---|---|---|---|
| California | P12 | 26.24 | 26.24 | 22.64 | 22.64 | -14.36 | -14.36 |
| Stanford | P12 | 5.64 | 5.64 | 53.33 | 53.33 | 0.38 | 0.38 |
| UCLA | P12 | 4.02 | 4.02 | 63.33 | 63.33 | 1.07 | 1.07 |
| Arizona | P12 | 4.00 | 4.00 | 78.12 | 78.12 | 2.25 | 2.25 |
| USC | P12 | 4.00 | 4.00 | 65.62 | 65.62 | 1.25 | 1.25 |
| Washington St. | P12 | 3.97 | 3.97 | 34.48 | 34.48 | -1.23 | -1.23 |
| Washington | P12 | 3.93 | 3.93 | 60.00 | 60.00 | 0.79 | 0.79 |
| Arizona St. | P12 | 3.92 | 3.92 | 62.07 | 62.07 | 0.95 | 0.95 |
| Oregon | P12 | 2.57 | 2.57 | 63.64 | 63.64 | 0.70 | 0.70 |
| Colorado | P12 | 2.49 | 2.49 | 51.61 | 51.61 | 0.08 | 0.08 |
| Oregon St. | P12 | 2.48 | 2.48 | 51.61 | 51.61 | 0.08 | 0.08 |
| Utah | P12 | 2.41 | 2.41 | 62.07 | 62.07 | 0.58 | 0.58 |
| Cal Poly | BW | 1.86 | 1.86 | 25.00 | 25.00 | -0.93 | -0.93 |
| Cal St. Fullerton | BW | 1.85 | 1.85 | 64.29 | 64.29 | 0.53 | 0.53 |
| UC Riverside | BW | 1.84 | 1.84 | 21.43 | 21.43 | -1.05 | -1.05 |
| Cal St. Northridge | BW | 1.78 | 1.78 | 14.81 | 14.81 | -1.25 | -1.25 |
| Seattle | WAC | 1.77 | 1.77 | 58.62 | 58.62 | 0.30 | 0.30 |
| Portland St. | BSky | 1.74 | 1.74 | 55.17 | 55.17 | 0.18 | 0.18 |
| Saint Mary's | WCC | 1.72 | 1.72 | 84.38 | 84.38 | 1.18 | 1.18 |
| San Diego St. | MWC | 1.72 | 1.72 | 70.00 | 70.00 | 0.69 | 0.69 |
| Central Arkansas | Slnd | 1.69 | 1.69 | 48.39 | 48.39 | -0.05 | -0.05 |
| VCU | A10 | 1.61 | 1.61 | 53.12 | 53.12 | 0.10 | 0.10 |
| Wichita St. | Amer | 1.61 | 1.61 | 77.42 | 77.42 | 0.88 | 0.88 |
| Wofford | SC | 1.61 | 1.61 | 62.07 | 62.07 | 0.39 | 0.39 |
| Long Beach St. | BW | 0.42 | 0.42 | 41.94 | 41.94 | -0.07 | -0.07 |
| UC Davis | BW | 0.38 | 0.38 | 66.67 | 66.67 | 0.13 | 0.13 |
| UC Irvine | BW | 0.38 | 0.38 | 48.48 | 48.48 | -0.01 | -0.01 |
| UC Santa Barbara | BW | 0.30 | 0.30 | 70.00 | 70.00 | 0.12 | 0.12 |
| Eastern Washington | BSky | 0.29 | 0.29 | 56.25 | 56.25 | 0.04 | 0.04 |
| Hawaii | BW | 0.25 | 0.25 | 53.57 | 53.57 | 0.02 | 0.02 |
| Idaho St. | BSky | 0.24 | 0.24 | 42.86 | 42.86 | -0.03 | -0.03 |
| Loyola Marymount | WCC | 0.24 | 0.24 | 33.33 | 33.33 | -0.08 | -0.08 |
| Montana | BSky | 0.23 | 0.23 | 77.42 | 77.42 | 0.13 | 0.13 |
| Pacific | WCC | 0.20 | 0.20 | 41.94 | 41.94 | -0.03 | -0.03 |
| San Francisco | WCC | 0.20 | 0.20 | 53.12 | 53.12 | 0.01 | 0.01 |
| Sacramento St. | BSky | 0.19 | 0.19 | 16.67 | 16.67 | -0.13 | -0.13 |
| Kansas | B12 | 0.18 | 0.18 | 79.41 | 79.41 | 0.10 | 0.10 |
| SMU | Amer | 0.17 | 0.17 | 51.52 | 51.52 | 0.01 | 0.01 |
| Fresno St. | MWC | 0.16 | 0.16 | 63.33 | 63.33 | 0.04 | 0.04 |
| New Mexico St. | WAC | 0.15 | 0.15 | 83.33 | 83.33 | 0.10 | 0.10 |
| Cal St. Bakersfield | WAC | 0.15 | 0.15 | 33.33 | 33.33 | -0.05 | -0.05 |
| Santa Clara | WCC | 0.15 | 0.15 | 34.48 | 34.48 | -0.05 | -0.05 |
| Utah Valley | WAC | 0.14 | 0.14 | 65.52 | 65.52 | 0.04 | 0.04 |
| Idaho | BSky | 0.13 | 0.13 | 68.97 | 68.97 | 0.05 | 0.05 |
| Portland | WCC | 0.13 | 0.13 | 24.14 | 24.14 | -0.07 | -0.07 |
| Bethune Cookman | MEAC | 0.13 | 0.13 | 53.33 | 53.33 | 0.01 | 0.01 |
| Pepperdine | WCC | 0.13 | 0.13 | 16.13 | 16.13 | -0.09 | -0.09 |
| Northern Arizona | BSky | 0.13 | 0.13 | 13.33 | 13.33 | -0.09 | -0.09 |
| UNLV | MWC | 0.13 | 0.13 | 60.61 | 60.61 | 0.03 | 0.03 |
| Gonzaga | WCC | 0.13 | 0.13 | 88.24 | 88.24 | 0.10 | 0.10 |
| New Mexico | MWC | 0.12 | 0.12 | 54.55 | 54.55 | 0.01 | 0.01 |
| Connecticut | Amer | 0.12 | 0.12 | 43.75 | 43.75 | -0.02 | -0.02 |
| Mercer | SC | 0.11 | 0.11 | 53.33 | 53.33 | 0.01 | 0.01 |
| Air Force | MWC | 0.11 | 0.11 | 34.48 | 34.48 | -0.03 | -0.03 |
| Kansas St. | B12 | 0.10 | 0.10 | 66.67 | 66.67 | 0.03 | 0.03 |
| Michigan | B10 | 0.10 | 0.10 | 79.41 | 79.41 | 0.06 | 0.06 |
| Colorado St. | MWC | 0.10 | 0.10 | 32.26 | 32.26 | -0.04 | -0.04 |
| Cincinnati | Amer | 0.10 | 0.10 | 88.24 | 88.24 | 0.08 | 0.08 |
| BYU | WCC | 0.10 | 0.10 | 70.59 | 70.59 | 0.04 | 0.04 |
| North Carolina | ACC | 0.10 | 0.10 | 71.43 | 71.43 | 0.04 | 0.04 |
| San Diego | WCC | 0.10 | 0.10 | 56.67 | 56.67 | 0.01 | 0.01 |
| Vanderbilt | SEC | 0.10 | 0.10 | 37.50 | 37.50 | -0.02 | -0.02 |
| Denver | Sum | 0.10 | 0.10 | 46.43 | 46.43 | -0.01 | -0.01 |
| Dayton | A10 | 0.10 | 0.10 | 45.16 | 45.16 | -0.01 | -0.01 |
| Oklahoma | B12 | 0.10 | 0.10 | 58.06 | 58.06 | 0.02 | 0.02 |
| North Dakota St. | Sum | 0.09 | 0.09 | 41.38 | 41.38 | -0.02 | -0.02 |
| Texas A&M | SEC | 0.09 | 0.09 | 62.50 | 62.50 | 0.02 | 0.02 |
| Grand Canyon | WAC | 0.08 | 0.08 | 65.62 | 65.62 | 0.03 | 0.03 |
| UNC Greensboro | SC | 0.08 | 0.08 | 77.42 | 77.42 | 0.04 | 0.04 |
| UT Rio Grande Valley | WAC | 0.08 | 0.08 | 43.33 | 43.33 | -0.01 | -0.01 |
| Utah St. | MWC | 0.08 | 0.08 | 48.48 | 48.48 | -0.00 | -0.00 |
| Harvard | Ivy | 0.08 | 0.08 | 56.67 | 56.67 | 0.01 | 0.01 |
| UMKC | WAC | 0.08 | 0.08 | 27.59 | 27.59 | -0.04 | -0.04 |
| Georgia | SEC | 0.08 | 0.08 | 54.55 | 54.55 | 0.01 | 0.01 |
| VMI | SC | 0.08 | 0.08 | 25.00 | 25.00 | -0.04 | -0.04 |
| Nevada | MWC | 0.08 | 0.08 | 79.41 | 79.41 | 0.05 | 0.05 |
| George Mason | A10 | 0.08 | 0.08 | 48.48 | 48.48 | -0.00 | -0.00 |
| Belmont | OVC | 0.08 | 0.08 | 72.73 | 72.73 | 0.04 | 0.04 |
| Detroit | Horz | 0.08 | 0.08 | 20.00 | 20.00 | -0.05 | -0.05 |
| Georgia Tech | ACC | 0.08 | 0.08 | 40.62 | 40.62 | -0.01 | -0.01 |
| Kennesaw St. | ASun | 0.08 | 0.08 | 28.57 | 28.57 | -0.03 | -0.03 |
| Nicholls St. | Slnd | 0.08 | 0.08 | 60.71 | 60.71 | 0.02 | 0.02 |
| Northwestern St. | Slnd | 0.08 | 0.08 | 8.00 | 8.00 | -0.06 | -0.06 |
| St. John's | BE | 0.08 | 0.08 | 46.88 | 46.88 | -0.00 | -0.00 |
| Wyoming | MWC | 0.08 | 0.08 | 59.38 | 59.38 | 0.01 | 0.01 |
| Xavier | BE | 0.08 | 0.08 | 84.85 | 84.85 | 0.05 | 0.05 |
| Saint Louis | A10 | 0.08 | 0.08 | 50.00 | 50.00 | 0.00 | 0.00 |
| Saint Joseph's | A10 | 0.08 | 0.08 | 50.00 | 50.00 | 0.00 | 0.00 |
| San Jose St. | MWC | 0.08 | 0.08 | 10.34 | 10.34 | -0.06 | -0.06 |
| Boise St. | MWC | 0.08 | 0.08 | 73.33 | 73.33 | 0.04 | 0.04 |
| Texas Southern | SWAC | 0.08 | 0.08 | 44.12 | 44.12 | -0.01 | -0.01 |
| Houston | Amer | 0.08 | 0.08 | 78.79 | 78.79 | 0.04 | 0.04 |
| South Carolina St. | MEAC | 0.08 | 0.08 | 26.67 | 26.67 | -0.04 | -0.04 |
| Stephen F. Austin | Slnd | 0.08 | 0.08 | 80.00 | 80.00 | 0.05 | 0.05 |
| Temple | Amer | 0.08 | 0.08 | 53.12 | 53.12 | 0.00 | 0.00 |
| Tulsa | Amer | 0.08 | 0.08 | 61.29 | 61.29 | 0.02 | 0.02 |
| Princeton | Ivy | 0.08 | 0.08 | 42.86 | 42.86 | -0.01 | -0.01 |
| Florida | SEC | 0.07 | 0.07 | 62.50 | 62.50 | 0.02 | 0.02 |
| Northeastern | CAA | 0.07 | 0.07 | 68.75 | 68.75 | 0.03 | 0.03 |
| Ohio St. | B10 | 0.07 | 0.07 | 75.00 | 75.00 | 0.04 | 0.04 |
| Butler | BE | 0.05 | 0.05 | 60.61 | 60.61 | 0.01 | 0.01 |
| Chattanooga | SC | 0.05 | 0.05 | 25.81 | 25.81 | -0.03 | -0.03 |
| Chicago St. | WAC | 0.05 | 0.05 | 3.33 | 3.33 | -0.05 | -0.05 |
| East Tennessee St. | SC | 0.05 | 0.05 | 71.88 | 71.88 | 0.02 | 0.02 |
| Furman | SC | 0.05 | 0.05 | 67.74 | 67.74 | 0.02 | 0.02 |
| Montana St. | BSky | 0.05 | 0.05 | 36.67 | 36.67 | -0.01 | -0.01 |
| Samford | SC | 0.05 | 0.05 | 26.67 | 26.67 | -0.03 | -0.03 |
| The Citadel | SC | 0.05 | 0.05 | 27.59 | 27.59 | -0.02 | -0.02 |
| Weber St. | BSky | 0.05 | 0.05 | 60.71 | 60.71 | 0.01 | 0.01 |
| Western Carolina | SC | 0.05 | 0.05 | 36.67 | 36.67 | -0.01 | -0.01 |
| College of Charleston | CAA | 0.05 | 0.05 | 77.42 | 77.42 | 0.03 | 0.03 |
| Northern Colorado | BSky | 0.05 | 0.05 | 61.29 | 61.29 | 0.01 | 0.01 |
| Southern Utah | BSky | 0.05 | 0.05 | 36.67 | 36.67 | -0.01 | -0.01 |
| IUPUI | Horz | 0.05 | 0.05 | 32.14 | 32.14 | -0.02 | -0.02 |
| Longwood | BSth | 0.05 | 0.05 | 13.33 | 13.33 | -0.04 | -0.04 |
| UTEP | CUSA | 0.05 | 0.05 | 33.33 | 33.33 | -0.02 | -0.02 |
| Grambling St. | SWAC | 0.05 | 0.05 | 53.33 | 53.33 | 0.00 | 0.00 |
| North Florida | ASun | 0.05 | 0.05 | 36.67 | 36.67 | -0.01 | -0.01 |
| UNC Asheville | BSth | 0.05 | 0.05 | 61.29 | 61.29 | 0.01 | 0.01 |
| McNeese St. | Slnd | 0.05 | 0.05 | 32.00 | 32.00 | -0.02 | -0.02 |
| Prairie View A&M | SWAC | 0.05 | 0.05 | 45.45 | 45.45 | -0.00 | -0.00 |
| Abilene Christian | Slnd | 0.05 | 0.05 | 44.44 | 44.44 | -0.01 | -0.01 |
| Baylor | B12 | 0.05 | 0.05 | 54.84 | 54.84 | 0.00 | 0.00 |
| Creighton | BE | 0.05 | 0.05 | 64.52 | 64.52 | 0.01 | 0.01 |
| Kentucky | SEC | 0.05 | 0.05 | 70.59 | 70.59 | 0.02 | 0.02 |
| Lamar | Slnd | 0.05 | 0.05 | 53.57 | 53.57 | 0.00 | 0.00 |
| Little Rock | SB | 0.05 | 0.05 | 20.00 | 20.00 | -0.03 | -0.03 |
| Morehead St. | OVC | 0.05 | 0.05 | 22.22 | 22.22 | -0.03 | -0.03 |
| Nebraska Omaha | Sum | 0.05 | 0.05 | 24.14 | 24.14 | -0.03 | -0.03 |
| Providence | BE | 0.05 | 0.05 | 61.76 | 61.76 | 0.01 | 0.01 |
| Sam Houston St. | Slnd | 0.05 | 0.05 | 51.72 | 51.72 | 0.00 | 0.00 |
| South Dakota | Sum | 0.05 | 0.05 | 73.33 | 73.33 | 0.02 | 0.02 |
| South Dakota St. | Sum | 0.05 | 0.05 | 80.00 | 80.00 | 0.03 | 0.03 |
| Southeastern Louisiana | Slnd | 0.05 | 0.05 | 63.33 | 63.33 | 0.01 | 0.01 |
| UCF | Amer | 0.05 | 0.05 | 59.38 | 59.38 | 0.01 | 0.01 |
| Virginia Tech | ACC | 0.05 | 0.05 | 65.62 | 65.62 | 0.02 | 0.02 |
| Wisconsin | B10 | 0.05 | 0.05 | 45.45 | 45.45 | -0.00 | -0.00 |
| Marquette | BE | 0.05 | 0.05 | 59.38 | 59.38 | 0.01 | 0.01 |
| Fordham | A10 | 0.05 | 0.05 | 29.03 | 29.03 | -0.02 | -0.02 |
| George Washington | A10 | 0.05 | 0.05 | 45.45 | 45.45 | -0.00 | -0.00 |
| Rhode Island | A10 | 0.05 | 0.05 | 78.12 | 78.12 | 0.03 | 0.03 |
| Richmond | A10 | 0.05 | 0.05 | 37.50 | 37.50 | -0.01 | -0.01 |
| Akron | MAC | 0.05 | 0.05 | 41.94 | 41.94 | -0.01 | -0.01 |
| Alabama | SEC | 0.05 | 0.05 | 55.88 | 55.88 | 0.01 | 0.01 |
| Lehigh | Pat | 0.05 | 0.05 | 51.72 | 51.72 | 0.00 | 0.00 |
| Middle Tennessee | CUSA | 0.05 | 0.05 | 76.67 | 76.67 | 0.03 | 0.03 |
| North Carolina St. | ACC | 0.05 | 0.05 | 65.62 | 65.62 | 0.01 | 0.01 |
| Purdue | B10 | 0.05 | 0.05 | 82.35 | 82.35 | 0.03 | 0.03 |
| UMBC | AE | 0.05 | 0.05 | 67.74 | 67.74 | 0.02 | 0.02 |
| Binghamton | AE | 0.03 | 0.03 | 31.03 | 31.03 | -0.01 | -0.01 |
| Morgan St. | MEAC | 0.03 | 0.03 | 36.67 | 36.67 | -0.01 | -0.01 |
| Southeast Missouri St. | OVC | 0.03 | 0.03 | 41.38 | 41.38 | -0.00 | -0.00 |
| Central Michigan | MAC | 0.03 | 0.03 | 53.33 | 53.33 | 0.00 | 0.00 |
| UT Arlington | SB | 0.03 | 0.03 | 60.61 | 60.61 | 0.01 | 0.01 |
| Valparaiso | MVC | 0.03 | 0.03 | 43.33 | 43.33 | -0.00 | -0.00 |
| Coastal Carolina | SB | 0.03 | 0.03 | 37.93 | 37.93 | -0.01 | -0.01 |
| Duke | ACC | 0.03 | 0.03 | 78.79 | 78.79 | 0.02 | 0.02 |
| High Point | BSth | 0.03 | 0.03 | 40.74 | 40.74 | -0.00 | -0.00 |
| Mississippi | SEC | 0.03 | 0.03 | 37.50 | 37.50 | -0.01 | -0.01 |
| Mississippi Valley St. | SWAC | 0.03 | 0.03 | 12.50 | 12.50 | -0.02 | -0.02 |
| Missouri | SEC | 0.03 | 0.03 | 61.29 | 61.29 | 0.01 | 0.01 |
| North Dakota | BSky | 0.03 | 0.03 | 33.33 | 33.33 | -0.01 | -0.01 |
| South Carolina | SEC | 0.03 | 0.03 | 50.00 | 50.00 | 0.00 | 0.00 |
| Texas Tech | B12 | 0.03 | 0.03 | 72.73 | 72.73 | 0.01 | 0.01 |
| Bradley | MVC | 0.03 | 0.03 | 59.38 | 59.38 | 0.00 | 0.00 |
| Eastern Illinois | OVC | 0.03 | 0.03 | 34.48 | 34.48 | -0.01 | -0.01 |
| Alcorn St. | SWAC | 0.03 | 0.03 | 25.00 | 25.00 | -0.01 | -0.01 |
| Arkansas Pine Bluff | SWAC | 0.03 | 0.03 | 40.00 | 40.00 | -0.01 | -0.01 |
| Arkansas St. | SB | 0.03 | 0.03 | 30.00 | 30.00 | -0.01 | -0.01 |
| Drake | MVC | 0.03 | 0.03 | 48.39 | 48.39 | -0.00 | -0.00 |
| East Carolina | Amer | 0.03 | 0.03 | 33.33 | 33.33 | -0.01 | -0.01 |
| Eastern Kentucky | OVC | 0.03 | 0.03 | 31.03 | 31.03 | -0.01 | -0.01 |
| Florida Gulf Coast | ASun | 0.03 | 0.03 | 64.52 | 64.52 | 0.01 | 0.01 |
| Houston Baptist | Slnd | 0.03 | 0.03 | 10.71 | 10.71 | -0.02 | -0.02 |
| Incarnate Word | Slnd | 0.03 | 0.03 | 12.50 | 12.50 | -0.02 | -0.02 |
| Iowa | B10 | 0.03 | 0.03 | 42.42 | 42.42 | -0.00 | -0.00 |
| Jacksonville St. | OVC | 0.03 | 0.03 | 62.50 | 62.50 | 0.01 | 0.01 |
| Kent St. | MAC | 0.03 | 0.03 | 48.48 | 48.48 | -0.00 | -0.00 |
| Marist | MAAC | 0.03 | 0.03 | 19.35 | 19.35 | -0.02 | -0.02 |
| Memphis | Amer | 0.03 | 0.03 | 61.76 | 61.76 | 0.01 | 0.01 |
| New Orleans | Slnd | 0.03 | 0.03 | 42.86 | 42.86 | -0.00 | -0.00 |
| Notre Dame | ACC | 0.03 | 0.03 | 57.58 | 57.58 | 0.00 | 0.00 |
| Oklahoma St. | B12 | 0.03 | 0.03 | 57.58 | 57.58 | 0.00 | 0.00 |
| Quinnipiac | MAAC | 0.03 | 0.03 | 36.36 | 36.36 | -0.01 | -0.01 |
| Savannah St. | MEAC | 0.03 | 0.03 | 43.33 | 43.33 | -0.00 | -0.00 |
| South Florida | Amer | 0.03 | 0.03 | 31.25 | 31.25 | -0.01 | -0.01 |
| Texas A&M Corpus Chris | Slnd | 0.03 | 0.03 | 30.77 | 30.77 | -0.01 | -0.01 |
| Tulane | Amer | 0.03 | 0.03 | 45.16 | 45.16 | -0.00 | -0.00 |
| Appalachian St. | SB | 0.02 | 0.02 | 41.94 | 41.94 | -0.00 | -0.00 |
| Bucknell | Pat | 0.02 | 0.02 | 73.53 | 73.53 | 0.01 | 0.01 |
| Davidson | A10 | 0.02 | 0.02 | 65.62 | 65.62 | 0.01 | 0.01 |
| Duquesne | A10 | 0.02 | 0.02 | 50.00 | 50.00 | 0.00 | 0.00 |
| La Salle | A10 | 0.02 | 0.02 | 40.62 | 40.62 | -0.00 | -0.00 |
| Massachusetts | A10 | 0.02 | 0.02 | 39.39 | 39.39 | -0.01 | -0.01 |
| Old Dominion | CUSA | 0.02 | 0.02 | 78.12 | 78.12 | 0.01 | 0.01 |
| Seton Hall | BE | 0.02 | 0.02 | 65.62 | 65.62 | 0.01 | 0.01 |
| St. Bonaventure | A10 | 0.02 | 0.02 | 78.12 | 78.12 | 0.01 | 0.01 |
| St. Francis PA | NEC | 0.02 | 0.02 | 57.14 | 57.14 | 0.00 | 0.00 |
| Texas | B12 | 0.02 | 0.02 | 57.58 | 57.58 | 0.00 | 0.00 |
| Virginia | ACC | 0.02 | 0.02 | 93.94 | 93.94 | 0.02 | 0.02 |
| Winthrop | BSth | 0.02 | 0.02 | 57.14 | 57.14 | 0.00 | 0.00 |
| Alabama St. | SWAC | 0.02 | 0.02 | 25.81 | 25.81 | -0.01 | -0.01 |
| Ball St. | MAC | 0.02 | 0.02 | 58.06 | 58.06 | 0.00 | 0.00 |
| Coppin St. | MEAC | 0.02 | 0.02 | 15.62 | 15.62 | -0.02 | -0.02 |
| DePaul | BE | 0.02 | 0.02 | 35.48 | 35.48 | -0.01 | -0.01 |