
 - Blog
| Conference: | MAAC |
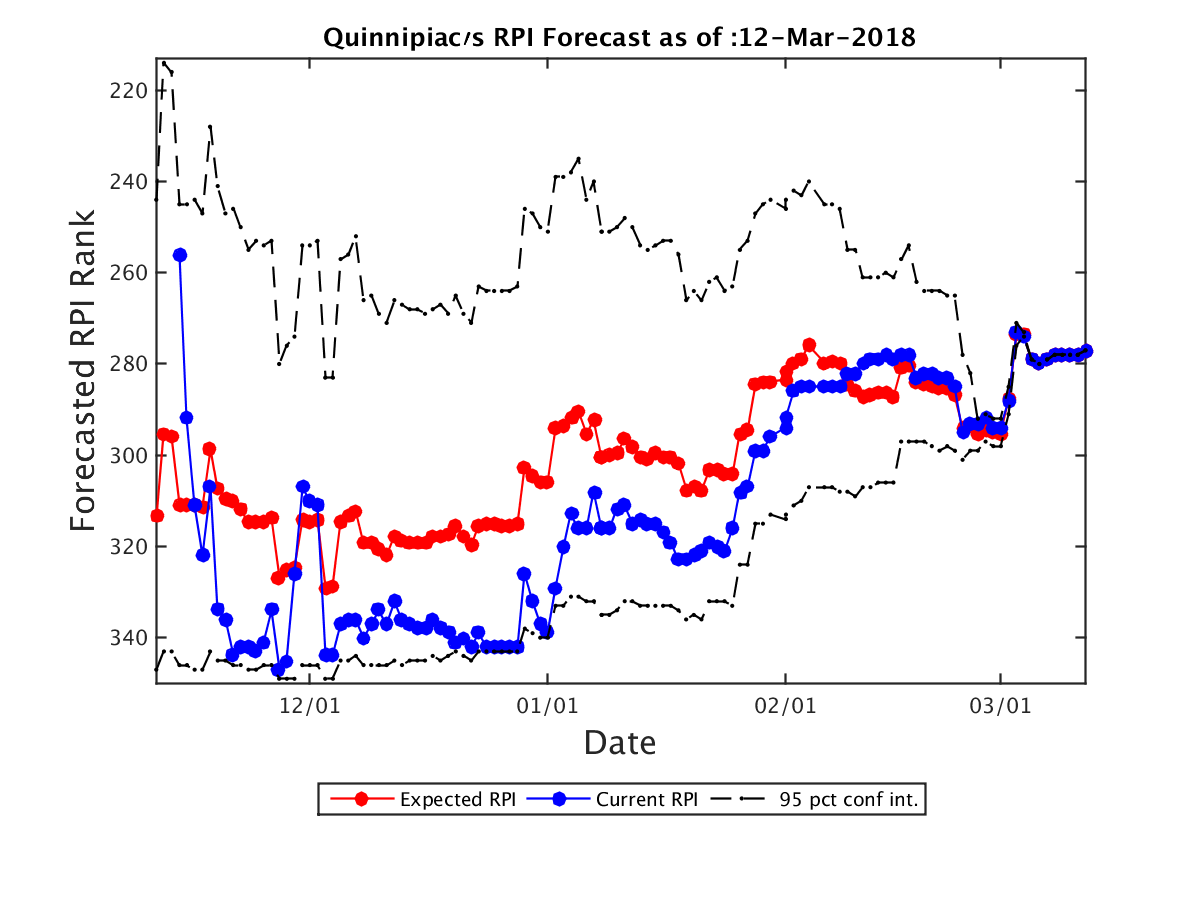
| Expected RPI: | 277.0 |
| Current RPI: | 277 |
| Expected SOS: | 290 |
| Current SOS: | 290 |
| Current Record: | 12-21 |
| Expected Record: | 12-21 |
| Current Conf Record: | 9-12 |
| Expected Conf Record: | 9-12 |
| Expected Record vs RPI 1-25: | 0-0 |
| Expected Record vs RPI 26-50: | 0-0 |
| Expected Record vs RPI 51-100: | 0-4 |
| Expected Record vs RPI 101-200: | 3-9 |
| Expected Record vs RPI 200+: | 9-8 |
| Current OOC Record: | 3-9 |
| Expected OOC Record: | 3-9 |
| Expected OOC RPI: | 336 |
| Expected OOC SOS: | 334 |
| Final Record | Expected RPI | Probability |
|---|---|---|
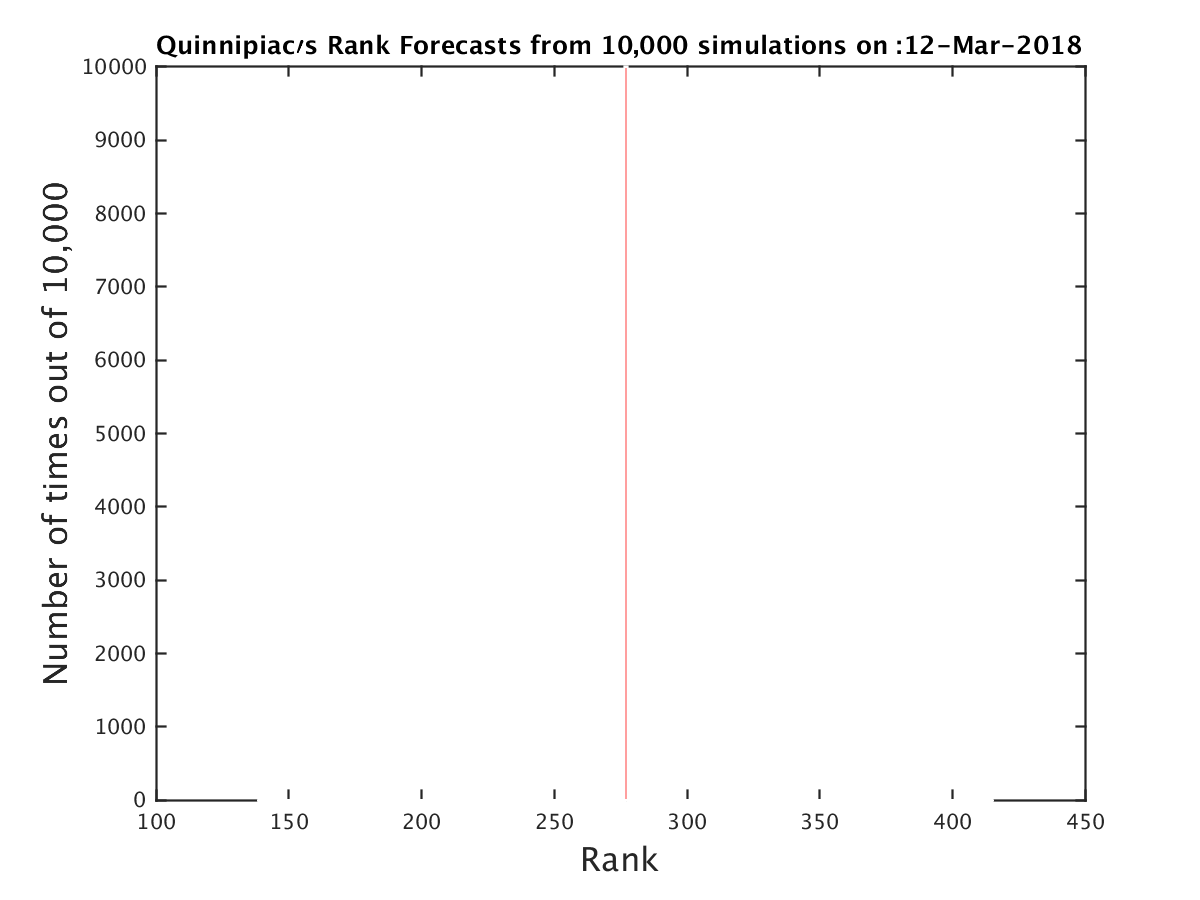
| 12-21 | 277.0 | 100.00% |
| Date | Opponent (Expected RPI) | Conf | Location | Score | Outcome | Prob(W) | Spread |
|---|---|---|---|---|---|---|---|
| 11-11 | Dartmouth (334.0) | Ivy | H | 78-77 | W | 100% | 0.0 |
| 11-13 | Brown (298.0) | Ivy | H | 72-79 | L | 0% | 0.0 |
| 11-17 | Colorado (82.0) | P12 | N | 70-69 | L | 0% | 0.0 |
| 11-18 | Wake Forest (160.0) | ACC | N | 72-55 | L | 0% | 0.0 |
| 11-19 | Liberty (211.0) | BSth | A | 84-72 | L | 0% | 0.0 |
| 11-26 | Maine (338.0) | AE | H | 72-78 | L | 0% | 0.0 |
| 11-29 | Massachusetts (240.0) | A10 | H | 68-66 | W | 100% | 0.0 |
| 12-2 | Lafayette (311.0) | Pat | A | 79-58 | L | 0% | 0.0 |
| 12-4 | Columbia (316.0) | Ivy | A | 87-89 | W | 100% | 0.0 |
| 12-7 | Hartford (198.0) | AE | A | 77-75 | L | 0% | 0.0 |
| 12-18 | Drexel (242.0) | CAA | A | 72-71 | L | 0% | 0.0 |
| 12-21 | Vermont (60.0) | AE | A | 80-73 | L | 0% | 0.0 |
| 12-28 | Monmouth (199.0) | MAAC | H | 78-76 | W | 100% | 0.0 |
| 1-1 | Siena (299.0) | MAAC | A | 70-71 | W | 100% | 0.0 |
| 1-5 | Canisius (124.0) | MAAC | H | 74-82 | L | 0% | 0.0 |
| 1-7 | Saint Peter's (251.0) | MAAC | A | 84-58 | L | 0% | 0.0 |
| 1-10 | Marist (324.0) | MAAC | H | 80-79 | W | 100% | 0.0 |
| 1-12 | Rider (69.0) | MAAC | A | 78-60 | L | 0% | 0.0 |
| 1-18 | Niagara (163.0) | MAAC | H | 73-81 | L | 0% | 0.0 |
| 1-21 | Siena (299.0) | MAAC | H | 76-69 | W | 100% | 0.0 |
| 1-25 | Marist (324.0) | MAAC | A | 77-85 | W | 100% | 0.0 |
| 1-27 | Fairfield (180.0) | MAAC | N | 75-70 | W | 100% | 0.0 |
| 2-2 | Iona (107.0) | MAAC | A | 87-82 | L | 0% | 0.0 |
| 2-4 | Rider (69.0) | MAAC | H | 59-74 | L | 0% | 0.0 |
| 2-8 | Niagara (163.0) | MAAC | A | 95-76 | L | 0% | 0.0 |
| 2-10 | Canisius (124.0) | MAAC | A | 71-64 | L | 0% | 0.0 |
| 2-15 | Manhattan (228.0) | MAAC | H | 71-70 | W | 100% | 0.0 |
| 2-17 | Fairfield (180.0) | MAAC | A | 102-98 | L | 0% | 0.0 |
| 2-23 | Saint Peter's (251.0) | MAAC | H | 43-52 | L | 0% | 0.0 |
| 2-25 | Manhattan (228.0) | MAAC | A | 92-86 | L | 0% | 0.0 |
| 3-1 | Siena (299.0) | MAAC | A | 58-67 | W | 100% | 0.0 |
| 3-2 | Canisius (124.0) | MAAC | N | 69-72 | W | 100% | 0.0 |
| 3-4 | Fairfield (180.0) | MAAC | N | 74-64 | L | 0% | 0.0 |
| Team | Conf | Curr Wgt | Fut Wgt | Curr W/L | Exp W/L | Curr Impact | Exp Impact |
|---|---|---|---|---|---|---|---|
| Quinnipiac | MAAC | 26.47 | 26.47 | 37.58 | 37.58 | -6.57 | -6.57 |
| Fairfield | MAAC | 5.41 | 5.41 | 50.00 | 50.00 | 0.00 | 0.00 |
| Siena | MAAC | 5.33 | 5.33 | 27.59 | 27.59 | -2.39 | -2.39 |
| Canisius | MAAC | 5.31 | 5.31 | 65.52 | 65.52 | 1.65 | 1.65 |
| Marist | MAAC | 3.98 | 3.98 | 20.69 | 20.69 | -2.33 | -2.33 |
| Saint Peter's | MAAC | 3.94 | 3.94 | 40.00 | 40.00 | -0.79 | -0.79 |
| Rider | MAAC | 3.91 | 3.91 | 68.97 | 68.97 | 1.48 | 1.48 |
| Niagara | MAAC | 3.91 | 3.91 | 56.67 | 56.67 | 0.52 | 0.52 |
| Manhattan | MAAC | 3.84 | 3.84 | 44.83 | 44.83 | -0.40 | -0.40 |
| Iona | MAAC | 2.58 | 2.58 | 59.38 | 59.38 | 0.48 | 0.48 |
| Monmouth | MAAC | 2.46 | 2.46 | 36.67 | 36.67 | -0.66 | -0.66 |
| Dartmouth | Ivy | 1.75 | 1.75 | 24.00 | 24.00 | -0.91 | -0.91 |
| Vermont | AE | 1.74 | 1.74 | 78.12 | 78.12 | 0.98 | 0.98 |
| Maine | AE | 1.71 | 1.71 | 10.34 | 10.34 | -1.36 | -1.36 |
| Brown | Ivy | 1.68 | 1.68 | 36.00 | 36.00 | -0.47 | -0.47 |
| Hartford | AE | 1.66 | 1.66 | 56.67 | 56.67 | 0.22 | 0.22 |
| Columbia | Ivy | 1.66 | 1.66 | 28.00 | 28.00 | -0.73 | -0.73 |
| Drexel | CAA | 1.59 | 1.59 | 35.48 | 35.48 | -0.46 | -0.46 |
| Massachusetts | A10 | 1.59 | 1.59 | 40.62 | 40.62 | -0.30 | -0.30 |
| Lafayette | Pat | 1.59 | 1.59 | 27.59 | 27.59 | -0.71 | -0.71 |
| Liberty | BSth | 1.54 | 1.54 | 53.33 | 53.33 | 0.10 | 0.10 |
| Wake Forest | ACC | 1.54 | 1.54 | 33.33 | 33.33 | -0.51 | -0.51 |
| Colorado | P12 | 1.52 | 1.52 | 51.61 | 51.61 | 0.05 | 0.05 |
| Albany | AE | 0.39 | 0.39 | 67.74 | 67.74 | 0.14 | 0.14 |
| New Hampshire | AE | 0.32 | 0.32 | 27.59 | 27.59 | -0.14 | -0.14 |
| Penn | Ivy | 0.29 | 0.29 | 74.19 | 74.19 | 0.14 | 0.14 |
| Harvard | Ivy | 0.27 | 0.27 | 56.67 | 56.67 | 0.04 | 0.04 |
| Army | Pat | 0.25 | 0.25 | 41.38 | 41.38 | -0.04 | -0.04 |
| Cornell | Ivy | 0.25 | 0.25 | 40.74 | 40.74 | -0.05 | -0.05 |
| UMass Lowell | AE | 0.25 | 0.25 | 37.93 | 37.93 | -0.06 | -0.06 |
| Yale | Ivy | 0.25 | 0.25 | 50.00 | 50.00 | 0.00 | 0.00 |
| Hofstra | CAA | 0.24 | 0.24 | 60.00 | 60.00 | 0.05 | 0.05 |
| St. Bonaventure | A10 | 0.24 | 0.24 | 78.12 | 78.12 | 0.13 | 0.13 |
| Stony Brook | AE | 0.23 | 0.23 | 38.71 | 38.71 | -0.05 | -0.05 |
| Princeton | Ivy | 0.22 | 0.22 | 42.86 | 42.86 | -0.03 | -0.03 |
| Holy Cross | Pat | 0.22 | 0.22 | 38.71 | 38.71 | -0.05 | -0.05 |
| Robert Morris | NEC | 0.21 | 0.21 | 48.48 | 48.48 | -0.01 | -0.01 |
| Lehigh | Pat | 0.19 | 0.19 | 51.72 | 51.72 | 0.01 | 0.01 |
| LIU Brooklyn | NEC | 0.19 | 0.19 | 51.52 | 51.52 | 0.01 | 0.01 |
| UMBC | AE | 0.19 | 0.19 | 67.74 | 67.74 | 0.07 | 0.07 |
| Loyola MD | Pat | 0.17 | 0.17 | 26.67 | 26.67 | -0.08 | -0.08 |
| Bucknell | Pat | 0.17 | 0.17 | 73.53 | 73.53 | 0.08 | 0.08 |
| Elon | CAA | 0.17 | 0.17 | 40.00 | 40.00 | -0.03 | -0.03 |
| Colgate | Pat | 0.15 | 0.15 | 58.06 | 58.06 | 0.02 | 0.02 |
| Bryant | NEC | 0.15 | 0.15 | 9.68 | 9.68 | -0.12 | -0.12 |
| Sacred Heart | NEC | 0.15 | 0.15 | 30.00 | 30.00 | -0.06 | -0.06 |
| Binghamton | AE | 0.15 | 0.15 | 31.03 | 31.03 | -0.06 | -0.06 |
| Wagner | NEC | 0.14 | 0.14 | 70.00 | 70.00 | 0.06 | 0.06 |
| College of Charleston | CAA | 0.14 | 0.14 | 77.42 | 77.42 | 0.08 | 0.08 |
| Houston | Amer | 0.14 | 0.14 | 78.79 | 78.79 | 0.08 | 0.08 |
| La Salle | A10 | 0.14 | 0.14 | 40.62 | 40.62 | -0.03 | -0.03 |
| Boston College | ACC | 0.13 | 0.13 | 55.88 | 55.88 | 0.02 | 0.02 |
| St. Francis NY | NEC | 0.13 | 0.13 | 37.93 | 37.93 | -0.03 | -0.03 |
| Seton Hall | BE | 0.12 | 0.12 | 65.62 | 65.62 | 0.04 | 0.04 |
| Buffalo | MAC | 0.12 | 0.12 | 75.76 | 75.76 | 0.06 | 0.06 |
| Gardner Webb | BSth | 0.12 | 0.12 | 37.93 | 37.93 | -0.03 | -0.03 |
| NJIT | ASun | 0.10 | 0.10 | 42.86 | 42.86 | -0.01 | -0.01 |
| Providence | BE | 0.10 | 0.10 | 61.76 | 61.76 | 0.02 | 0.02 |
| Rhode Island | A10 | 0.10 | 0.10 | 78.12 | 78.12 | 0.06 | 0.06 |
| Hampton | MEAC | 0.10 | 0.10 | 51.61 | 51.61 | 0.00 | 0.00 |
| UNC Asheville | BSth | 0.10 | 0.10 | 61.29 | 61.29 | 0.02 | 0.02 |
| Fordham | A10 | 0.10 | 0.10 | 29.03 | 29.03 | -0.04 | -0.04 |
| Syracuse | ACC | 0.10 | 0.10 | 60.61 | 60.61 | 0.02 | 0.02 |
| Towson | CAA | 0.10 | 0.10 | 53.33 | 53.33 | 0.01 | 0.01 |
| Louisville | ACC | 0.10 | 0.10 | 60.61 | 60.61 | 0.02 | 0.02 |
| Air Force | MWC | 0.09 | 0.09 | 34.48 | 34.48 | -0.03 | -0.03 |
| George Mason | A10 | 0.09 | 0.09 | 48.48 | 48.48 | -0.00 | -0.00 |
| Navy | Pat | 0.08 | 0.08 | 61.29 | 61.29 | 0.02 | 0.02 |
| Central Connecticut | NEC | 0.08 | 0.08 | 43.75 | 43.75 | -0.01 | -0.01 |
| Longwood | BSth | 0.08 | 0.08 | 13.33 | 13.33 | -0.06 | -0.06 |
| Penn St. | B10 | 0.08 | 0.08 | 61.76 | 61.76 | 0.02 | 0.02 |
| Northwestern | B10 | 0.08 | 0.08 | 45.16 | 45.16 | -0.01 | -0.01 |
| American | Pat | 0.08 | 0.08 | 20.00 | 20.00 | -0.05 | -0.05 |
| Boston University | Pat | 0.08 | 0.08 | 46.67 | 46.67 | -0.01 | -0.01 |
| Campbell | BSth | 0.07 | 0.07 | 46.43 | 46.43 | -0.01 | -0.01 |
| Radford | BSth | 0.07 | 0.07 | 62.50 | 62.50 | 0.02 | 0.02 |
| South Alabama | SB | 0.07 | 0.07 | 40.00 | 40.00 | -0.01 | -0.01 |
| Oregon St. | P12 | 0.07 | 0.07 | 50.00 | 50.00 | 0.00 | 0.00 |
| Xavier | BE | 0.07 | 0.07 | 84.85 | 84.85 | 0.05 | 0.05 |
| George Washington | A10 | 0.07 | 0.07 | 45.45 | 45.45 | -0.01 | -0.01 |
| Drake | MVC | 0.07 | 0.07 | 48.39 | 48.39 | -0.00 | -0.00 |
| Mercer | SC | 0.07 | 0.07 | 53.33 | 53.33 | 0.00 | 0.00 |
| Saint Joseph's | A10 | 0.07 | 0.07 | 50.00 | 50.00 | 0.00 | 0.00 |
| Arizona | P12 | 0.07 | 0.07 | 79.41 | 79.41 | 0.04 | 0.04 |
| Arizona St. | P12 | 0.07 | 0.07 | 64.52 | 64.52 | 0.02 | 0.02 |
| Arkansas Pine Bluff | SWAC | 0.07 | 0.07 | 40.00 | 40.00 | -0.01 | -0.01 |
| Evansville | MVC | 0.07 | 0.07 | 50.00 | 50.00 | 0.00 | 0.00 |
| Florida Gulf Coast | ASun | 0.07 | 0.07 | 64.52 | 64.52 | 0.02 | 0.02 |
| James Madison | CAA | 0.07 | 0.07 | 29.03 | 29.03 | -0.03 | -0.03 |
| Memphis | Amer | 0.07 | 0.07 | 61.76 | 61.76 | 0.02 | 0.02 |
| Pacific | WCC | 0.07 | 0.07 | 41.94 | 41.94 | -0.01 | -0.01 |
| Tennessee St. | OVC | 0.07 | 0.07 | 46.43 | 46.43 | -0.01 | -0.01 |
| Texas St. | SB | 0.07 | 0.07 | 41.94 | 41.94 | -0.01 | -0.01 |
| Youngstown St. | Horz | 0.07 | 0.07 | 20.00 | 20.00 | -0.04 | -0.04 |
| Coastal Carolina | SB | 0.07 | 0.07 | 37.93 | 37.93 | -0.02 | -0.02 |
| Richmond | A10 | 0.07 | 0.07 | 37.50 | 37.50 | -0.02 | -0.02 |
| BYU | WCC | 0.07 | 0.07 | 70.59 | 70.59 | 0.03 | 0.03 |
| Fairleigh Dickinson | NEC | 0.07 | 0.07 | 37.93 | 37.93 | -0.02 | -0.02 |
| Minnesota | B10 | 0.07 | 0.07 | 46.88 | 46.88 | -0.00 | -0.00 |
| Northeastern | CAA | 0.07 | 0.07 | 68.75 | 68.75 | 0.03 | 0.03 |
| Jacksonville | ASun | 0.07 | 0.07 | 37.93 | 37.93 | -0.02 | -0.02 |
| Old Dominion | CUSA | 0.07 | 0.07 | 78.12 | 78.12 | 0.04 | 0.04 |
| Purdue | B10 | 0.07 | 0.07 | 82.35 | 82.35 | 0.04 | 0.04 |
| Wright St. | Horz | 0.07 | 0.07 | 71.88 | 71.88 | 0.03 | 0.03 |
| Villanova | BE | 0.05 | 0.05 | 88.24 | 88.24 | 0.04 | 0.04 |
| Connecticut | Amer | 0.05 | 0.05 | 43.75 | 43.75 | -0.01 | -0.01 |
| Notre Dame | ACC | 0.05 | 0.05 | 57.58 | 57.58 | 0.01 | 0.01 |
| Charleston Southern | BSth | 0.05 | 0.05 | 42.86 | 42.86 | -0.01 | -0.01 |
| Duke | ACC | 0.05 | 0.05 | 78.79 | 78.79 | 0.03 | 0.03 |
| Georgia Tech | ACC | 0.05 | 0.05 | 40.62 | 40.62 | -0.01 | -0.01 |
| High Point | BSth | 0.05 | 0.05 | 40.74 | 40.74 | -0.01 | -0.01 |
| Missouri St. | MVC | 0.05 | 0.05 | 53.12 | 53.12 | 0.00 | 0.00 |
| Morgan St. | MEAC | 0.05 | 0.05 | 36.67 | 36.67 | -0.01 | -0.01 |
| Murray St. | OVC | 0.05 | 0.05 | 82.76 | 82.76 | 0.03 | 0.03 |
| Nebraska | B10 | 0.05 | 0.05 | 68.75 | 68.75 | 0.02 | 0.02 |
| North Carolina St. | ACC | 0.05 | 0.05 | 65.62 | 65.62 | 0.02 | 0.02 |
| Northern Illinois | MAC | 0.05 | 0.05 | 36.67 | 36.67 | -0.01 | -0.01 |
| Presbyterian | BSth | 0.05 | 0.05 | 27.59 | 27.59 | -0.02 | -0.02 |
| Stetson | ASun | 0.05 | 0.05 | 28.57 | 28.57 | -0.02 | -0.02 |
| The Citadel | SC | 0.05 | 0.05 | 27.59 | 27.59 | -0.02 | -0.02 |
| Tulsa | Amer | 0.05 | 0.05 | 61.29 | 61.29 | 0.01 | 0.01 |
| UC Irvine | BW | 0.05 | 0.05 | 48.48 | 48.48 | -0.00 | -0.00 |
| UMKC | WAC | 0.05 | 0.05 | 27.59 | 27.59 | -0.02 | -0.02 |
| UNC Greensboro | SC | 0.05 | 0.05 | 77.42 | 77.42 | 0.03 | 0.03 |
| Virginia | ACC | 0.05 | 0.05 | 93.94 | 93.94 | 0.04 | 0.04 |
| West Virginia | B12 | 0.05 | 0.05 | 70.59 | 70.59 | 0.02 | 0.02 |
| Winthrop | BSth | 0.05 | 0.05 | 57.14 | 57.14 | 0.01 | 0.01 |
| Georgia St. | SB | 0.05 | 0.05 | 68.75 | 68.75 | 0.02 | 0.02 |
| Kentucky | SEC | 0.05 | 0.05 | 70.59 | 70.59 | 0.02 | 0.02 |
| Alabama A&M | SWAC | 0.05 | 0.05 | 9.68 | 9.68 | -0.04 | -0.04 |
| Cleveland St. | Horz | 0.05 | 0.05 | 32.35 | 32.35 | -0.02 | -0.02 |
| Delaware | CAA | 0.05 | 0.05 | 38.71 | 38.71 | -0.01 | -0.01 |
| Houston Baptist | Slnd | 0.05 | 0.05 | 10.71 | 10.71 | -0.04 | -0.04 |
| Norfolk St. | MEAC | 0.05 | 0.05 | 43.33 | 43.33 | -0.01 | -0.01 |
| St. Francis PA | NEC | 0.05 | 0.05 | 57.14 | 57.14 | 0.01 | 0.01 |
| UCLA | P12 | 0.05 | 0.05 | 65.62 | 65.62 | 0.01 | 0.01 |
| UNC Wilmington | CAA | 0.05 | 0.05 | 30.00 | 30.00 | -0.02 | -0.02 |
| USC | P12 | 0.05 | 0.05 | 67.65 | 67.65 | 0.02 | 0.02 |
| UT Arlington | SB | 0.05 | 0.05 | 60.61 | 60.61 | 0.01 | 0.01 |
| Utah | P12 | 0.05 | 0.05 | 63.33 | 63.33 | 0.01 | 0.01 |
| Washington | P12 | 0.05 | 0.05 | 62.50 | 62.50 | 0.01 | 0.01 |
| Washington St. | P12 | 0.05 | 0.05 | 38.71 | 38.71 | -0.01 | -0.01 |
| William & Mary | CAA | 0.05 | 0.05 | 58.62 | 58.62 | 0.01 | 0.01 |
| Dayton | A10 | 0.05 | 0.05 | 45.16 | 45.16 | -0.00 | -0.00 |
| Northern Kentucky | Horz | 0.05 | 0.05 | 68.97 | 68.97 | 0.02 | 0.02 |
| Illinois Chicago | Horz | 0.03 | 0.03 | 50.00 | 50.00 | 0.00 | 0.00 |
| Georgetown | BE | 0.03 | 0.03 | 50.00 | 50.00 | 0.00 | 0.00 |
| Texas Tech | B12 | 0.03 | 0.03 | 72.73 | 72.73 | 0.01 | 0.01 |
| Alabama St. | SWAC | 0.02 | 0.02 | 25.81 | 25.81 | -0.01 | -0.01 |
| Charlotte | CUSA | 0.02 | 0.02 | 17.86 | 17.86 | -0.02 | -0.02 |
| Clemson | ACC | 0.02 | 0.02 | 71.88 | 71.88 | 0.01 | 0.01 |
| FIU | CUSA | 0.02 | 0.02 | 37.93 | 37.93 | -0.01 | -0.01 |
| Florida St. | ACC | 0.02 | 0.02 | 64.52 | 64.52 | 0.01 | 0.01 |
| Fort Wayne | Sum | 0.02 | 0.02 | 50.00 | 50.00 | 0.00 | 0.00 |
| Georgia Southern | SB | 0.02 | 0.02 | 61.29 | 61.29 | 0.01 | 0.01 |
| Howard | MEAC | 0.02 | 0.02 | 25.81 | 25.81 | -0.01 | -0.01 |
| Illinois | B10 | 0.02 | 0.02 | 41.94 | 41.94 | -0.00 | -0.00 |
| Maryland Eastern Shore | MEAC | 0.02 | 0.02 | 16.67 | 16.67 | -0.02 | -0.02 |
| Miami FL | ACC | 0.02 | 0.02 | 70.97 | 70.97 | 0.01 | 0.01 |
| Miami OH | MAC | 0.02 | 0.02 | 45.16 | 45.16 | -0.00 | -0.00 |
| North Carolina | ACC | 0.02 | 0.02 | 71.43 | 71.43 | 0.01 | 0.01 |
| Pittsburgh | ACC | 0.02 | 0.02 | 25.00 | 25.00 | -0.01 | -0.01 |
| Portland | WCC | 0.02 | 0.02 | 24.14 | 24.14 | -0.01 | -0.01 |
| Rutgers | B10 | 0.02 | 0.02 | 42.42 | 42.42 | -0.00 | -0.00 |
| Tennessee | SEC | 0.02 | 0.02 | 75.76 | 75.76 | 0.01 | 0.01 |
| Virginia Tech | ACC | 0.02 | 0.02 | 65.62 | 65.62 | 0.01 | 0.01 |
| Bowling Green | MAC | 0.02 | 0.02 | 46.67 | 46.67 | -0.00 | -0.00 |
| California | P12 | 0.02 | 0.02 | 25.81 | 25.81 | -0.01 | -0.01 |
| Colorado St. | MWC | 0.02 | 0.02 | 32.26 | 32.26 | -0.01 | -0.01 |
| Denver | Sum | 0.02 | 0.02 | 46.43 | 46.43 | -0.00 | -0.00 |
| Iowa | B10 | 0.02 | 0.02 | 42.42 | 42.42 | -0.00 | -0.00 |
| New Mexico | MWC | 0.02 | 0.02 | 54.55 | 54.55 | 0.00 | 0.00 |
| Northern Colorado | BSky | 0.02 | 0.02 | 61.29 | 61.29 | 0.01 | 0.01 |
| Oregon | P12 | 0.02 | 0.02 | 64.71 | 64.71 | 0.01 | 0.01 |
| San Diego | WCC | 0.02 | 0.02 | 56.67 | 56.67 | 0.00 | 0.00 |
| South Dakota St. | Sum | 0.02 | 0.02 | 80.00 | 80.00 | 0.01 | 0.01 |
| Stanford | P12 | 0.02 | 0.02 | 54.55 | 54.55 | 0.00 | 0.00 |
| Temple | Amer | 0.02 | 0.02 | 53.12 | 53.12 | 0.00 | 0.00 |
| Bradley | MVC | 0.02 | 0.02 | 59.38 | 59.38 | 0.00 | 0.00 |
| Davidson | A10 | 0.02 | 0.02 | 65.62 | 65.62 | 0.01 | 0.01 |
| Duquesne | A10 | 0.02 | 0.02 | 50.00 | 50.00 | 0.00 | 0.00 |
| Georgia | SEC | 0.02 | 0.02 | 54.55 | 54.55 | 0.00 | 0.00 |
| Marquette | BE | 0.02 | 0.02 | 59.38 | 59.38 | 0.00 | 0.00 |
| Ohio | MAC | 0.02 | 0.02 | 43.33 | 43.33 | -0.00 | -0.00 |
| Saint Louis | A10 | 0.02 | 0.02 | 50.00 | 50.00 | 0.00 | 0.00 |
| South Carolina | SEC | 0.02 | 0.02 | 50.00 | 50.00 | 0.00 | 0.00 |
| St. John's | BE | 0.02 | 0.02 | 46.88 | 46.88 | -0.00 | -0.00 |
| VCU | A10 | 0.02 | 0.02 | 54.55 | 54.55 | 0.00 | 0.00 |
| Weber St. | BSky | 0.02 | 0.02 | 60.71 | 60.71 | 0.00 | 0.00 |
| Western Carolina | SC | 0.02 | 0.02 | 36.67 | 36.67 | -0.01 | -0.01 |