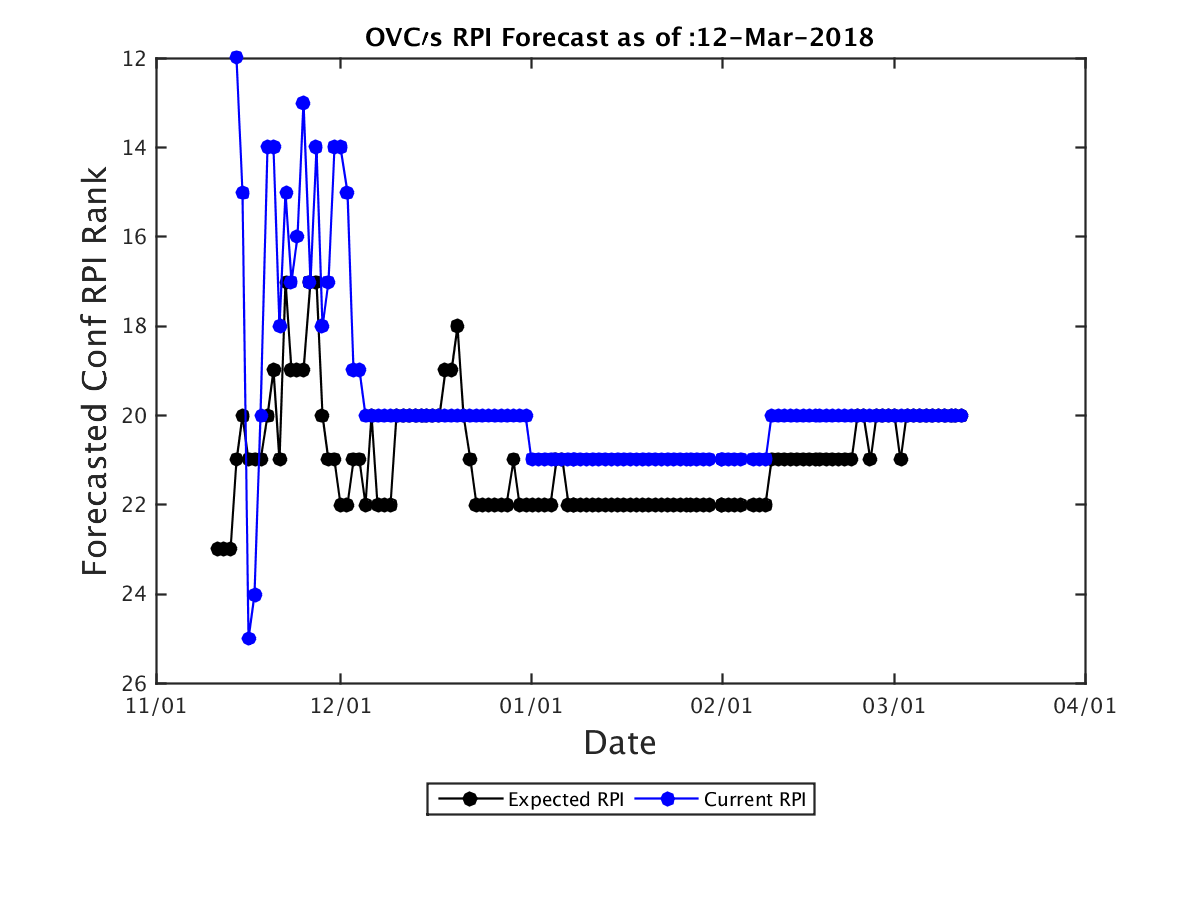
| Expected RPI: | 20 |
| Current RPI: | 20 |
| Current OOC Record: | 53-73 (0.4206) |
| Expected OOC Record: | 53-73 (0.4206) |
| Expected OOC RPI: | 21 |
| Expected OOC SOS: | 22 |
| Expected RPI Rank | Team | RPI Forecast | SOS Forecast | SOS Rank Forecast | Curr W-L | Proj W-L | Current Conf W-L | Proj Conf W-L | 1-25 W-L | 26-50 W-L | 51-100 W-L | 101-200 W-L | 200+ W-L | Proj OOC W-L | Proj OOC RPI | Proj OOC SOS | Current RPI |
|---|---|---|---|---|---|---|---|---|---|---|---|---|---|---|---|---|---|
| 48.0 | Murray St. | 0.5751 | 0.4886 | 193 | 24-5 | 24-5 | 18-2 | 18-2 | 0-1 | 0-1 | 4-1 | 7-2 | 13-0 | 6-3 | 103 | 139 | 48 |
| 81.0 | Belmont | 0.5561 | 0.4920 | 179 | 24-9 | 24-9 | 16-4 | 16-4 | 0-0 | 3-3 | 0-1 | 7-5 | 14-0 | 8-5 | 89 | 105 | 81 |
| 149.0 | Jacksonville St. | 0.5102 | 0.4702 | 239 | 20-12 | 20-12 | 12-8 | 12-8 | 0-1 | 1-2 | 2-1 | 5-5 | 12-3 | 8-4 | 200 | 340 | 149 |
| 158.0 | Tennessee Tech | 0.5046 | 0.4799 | 213 | 17-14 | 17-14 | 11-9 | 11-9 | 0-0 | 0-3 | 0-3 | 6-6 | 11-2 | 6-5 | 146 | 245 | 158 |
| 164.0 | Austin Peay | 0.5034 | 0.4918 | 180 | 16-14 | 16-14 | 13-7 | 13-7 | 0-1 | 0-3 | 0-3 | 4-7 | 12-0 | 3-7 | 260 | 128 | 164 |
| 189.0 | Tennessee St. | 0.4913 | 0.4935 | 174 | 13-15 | 13-15 | 10-9 | 10-9 | 0-2 | 0-2 | 1-2 | 4-3 | 8-6 | 3-6 | 131 | 25 | 189 |
| 257.0 | Southeast Missouri St. | 0.4519 | 0.4580 | 279 | 12-17 | 12-17 | 8-10 | 8-10 | 0-0 | 0-2 | 1-2 | 1-8 | 10-5 | 4-7 | 246 | 262 | 257 |
| 262.0 | Eastern Illinois | 0.4478 | 0.4749 | 225 | 10-19 | 10-19 | 8-12 | 8-12 | 0-0 | 0-2 | 0-5 | 2-7 | 8-5 | 2-7 | 306 | 255 | 262 |
| 271.0 | Eastern Kentucky | 0.4403 | 0.4744 | 226 | 9-20 | 9-20 | 5-13 | 5-13 | 0-0 | 0-2 | 0-3 | 1-10 | 8-5 | 4-7 | 217 | 206 | 271 |
| 287.0 | SIU Edwardsville | 0.4312 | 0.4690 | 245 | 9-21 | 9-21 | 5-14 | 5-14 | 0-1 | 0-3 | 0-3 | 2-7 | 7-7 | 4-7 | 262 | 293 | 287 |
| 292.0 | Morehead St. | 0.4277 | 0.5031 | 143 | 6-21 | 6-21 | 4-14 | 4-14 | 0-1 | 0-2 | 1-3 | 1-8 | 4-7 | 2-7 | 203 | 21 | 292 |
| 306.0 | Tennessee Martin | 0.4155 | 0.4514 | 305 | 8-21 | 8-21 | 5-13 | 5-13 | 0-0 | 0-2 | 0-4 | 2-4 | 6-11 | 3-8 | 298 | 305 | 306 |