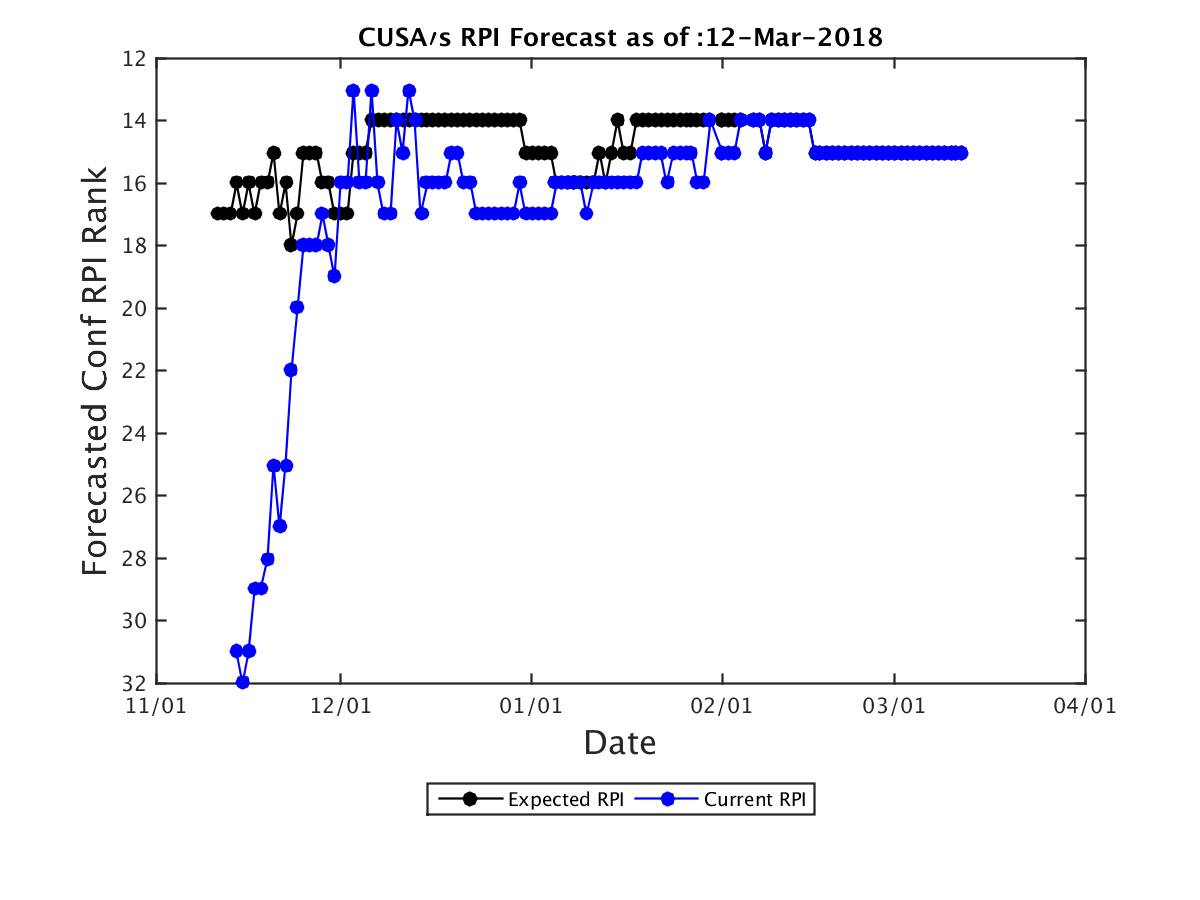
| Expected RPI: | 15 |
| Current RPI: | 15 |
| Current OOC Record: | 71-79 (0.4733) |
| Expected OOC Record: | 71-79 (0.4733) |
| Expected OOC RPI: | 20 |
| Expected OOC SOS: | 23 |
| Expected RPI Rank | Team | RPI Forecast | SOS Forecast | SOS Rank Forecast | Curr W-L | Proj W-L | Current Conf W-L | Proj Conf W-L | 1-25 W-L | 26-50 W-L | 51-100 W-L | 101-200 W-L | 200+ W-L | Proj OOC W-L | Proj OOC RPI | Proj OOC SOS | Current RPI |
|---|---|---|---|---|---|---|---|---|---|---|---|---|---|---|---|---|---|
| 33.0 | Middle Tennessee | 0.5897 | 0.5320 | 90 | 23-7 | 23-7 | 16-3 | 16-3 | 0-1 | 3-2 | 1-3 | 10-0 | 9-1 | 7-4 | 25 | 10 | 33 |
| 39.0 | Western Kentucky | 0.5807 | 0.5424 | 80 | 23-10 | 23-10 | 16-5 | 16-5 | 1-1 | 0-2 | 6-2 | 7-4 | 9-1 | 7-5 | 74 | 33 | 39 |
| 78.0 | Old Dominion | 0.5571 | 0.4809 | 207 | 25-7 | 25-7 | 16-4 | 16-4 | 0-0 | 0-4 | 2-2 | 10-1 | 13-0 | 9-3 | 95 | 263 | 78 |
| 87.0 | Marshall | 0.5522 | 0.4954 | 165 | 23-10 | 23-10 | 15-6 | 15-6 | 0-1 | 3-2 | 1-3 | 3-3 | 16-1 | 8-4 | 133 | 275 | 87 |
| 155.0 | UAB | 0.5082 | 0.4899 | 187 | 18-13 | 18-13 | 11-9 | 11-9 | 0-2 | 1-4 | 1-2 | 3-4 | 13-1 | 7-4 | 202 | 304 | 155 |
| 187.0 | UTSA | 0.4922 | 0.4699 | 241 | 16-14 | 16-14 | 12-8 | 12-8 | 0-0 | 1-2 | 1-5 | 3-1 | 11-6 | 4-6 | 232 | 256 | 187 |
| 192.0 | Louisiana Tech | 0.4877 | 0.4978 | 155 | 15-16 | 15-16 | 8-12 | 8-12 | 0-0 | 0-4 | 0-5 | 2-4 | 13-3 | 7-4 | 130 | 157 | 192 |
| 207.0 | Southern Miss | 0.4792 | 0.5045 | 136 | 12-18 | 12-18 | 9-12 | 9-12 | 0-1 | 1-3 | 0-6 | 3-5 | 8-3 | 3-6 | 225 | 165 | 207 |
| 235.0 | North Texas | 0.4629 | 0.4725 | 228 | 13-17 | 13-17 | 8-11 | 8-11 | 0-0 | 0-3 | 0-3 | 5-5 | 8-6 | 5-6 | 186 | 170 | 235 |
| 275.0 | Florida Atlantic | 0.4370 | 0.4723 | 229 | 9-19 | 9-19 | 6-13 | 6-13 | 0-1 | 0-2 | 0-3 | 2-6 | 7-7 | 3-6 | 248 | 212 | 275 |
| 293.0 | UTEP | 0.4276 | 0.4783 | 218 | 10-20 | 10-20 | 6-13 | 6-13 | 0-0 | 0-5 | 0-3 | 3-5 | 7-7 | 4-7 | 274 | 175 | 293 |
| 295.0 | FIU | 0.4259 | 0.4534 | 298 | 11-18 | 11-18 | 8-11 | 8-11 | 0-0 | 0-2 | 0-4 | 3-2 | 8-10 | 3-7 | 327 | 322 | 295 |
| 323.0 | Charlotte | 0.4022 | 0.4798 | 214 | 5-23 | 5-23 | 2-16 | 2-16 | 0-0 | 0-4 | 0-6 | 0-4 | 5-9 | 3-7 | 315 | 315 | 323 |
| 328.0 | Rice | 0.3997 | 0.4778 | 219 | 5-24 | 5-24 | 4-14 | 4-14 | 0-1 | 0-2 | 0-2 | 0-10 | 5-9 | 1-10 | 319 | 187 | 328 |