
 - Blog
| Conference: | WCC |
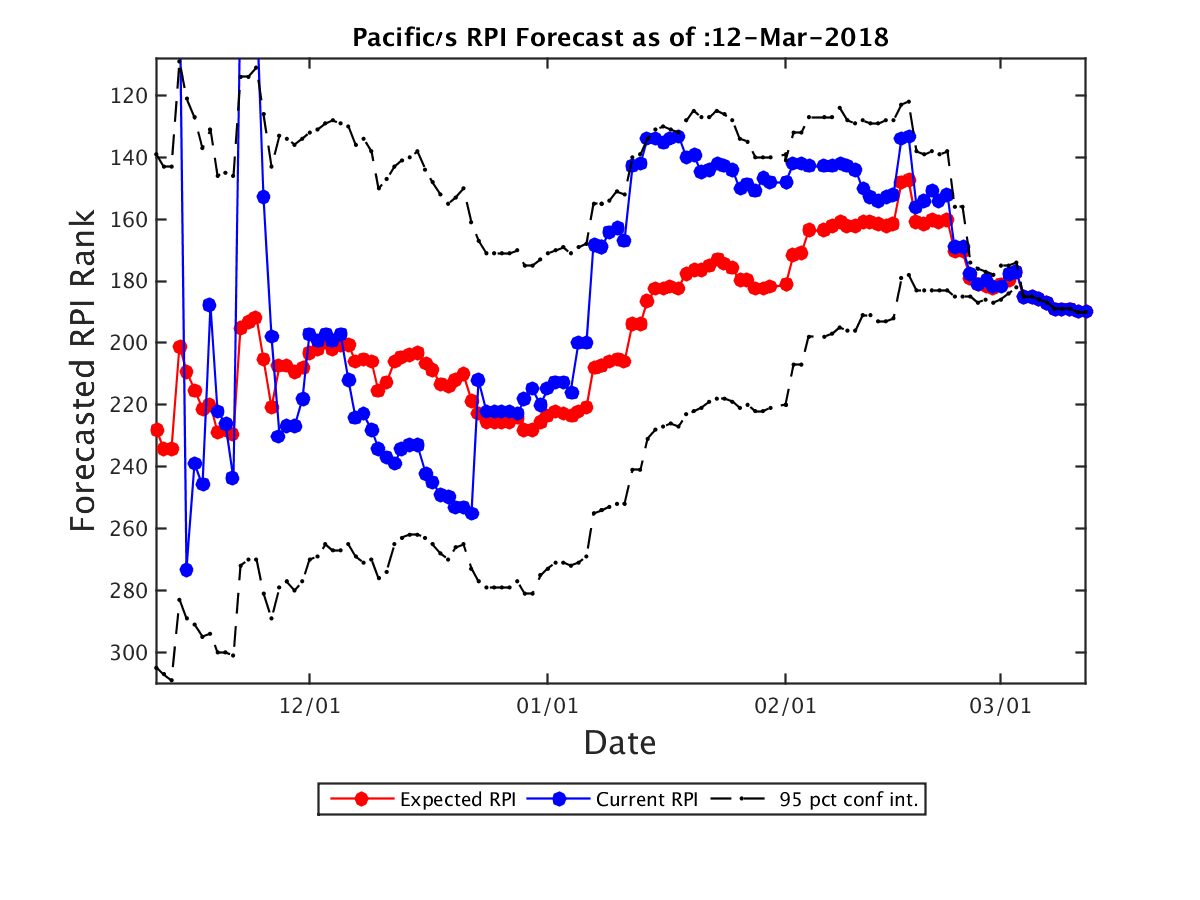
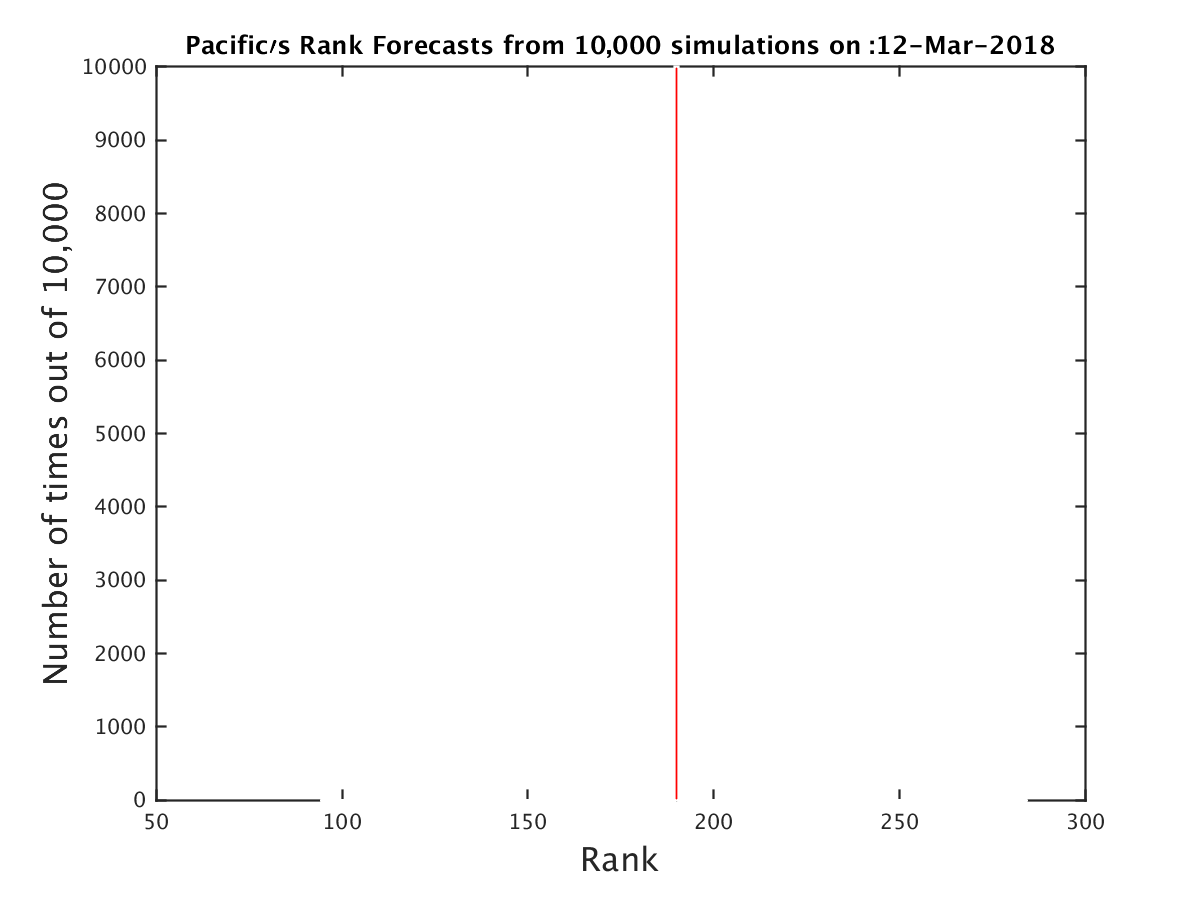
| Expected RPI: | 190.0 |
| Current RPI: | 190 |
| Expected SOS: | 120 |
| Current SOS: | 120 |
| Current Record: | 13-18 |
| Expected Record: | 13-18 |
| Current Conf Record: | 9-10 |
| Expected Conf Record: | 9-10 |
| Expected Record vs RPI 1-25: | 0-3 |
| Expected Record vs RPI 26-50: | 0-2 |
| Expected Record vs RPI 51-100: | 1-4 |
| Expected Record vs RPI 101-200: | 3-6 |
| Expected Record vs RPI 200+: | 9-3 |
| Current OOC Record: | 4-8 |
| Expected OOC Record: | 4-8 |
| Expected OOC RPI: | 214 |
| Expected OOC SOS: | 91 |
| Final Record | Expected RPI | Probability |
|---|---|---|
| 13-18 | 190.0 | 100.00% |
| Date | Opponent (Expected RPI) | Conf | Location | Score | Outcome | Prob(W) | Spread |
|---|---|---|---|---|---|---|---|
| 11-12 | Stanford (86.0) | P12 | A | 89-80 | L | 0% | 0.0 |
| 11-15 | UC Davis (102.0) | BW | H | 58-62 | L | 0% | 0.0 |
| 11-18 | Nevada (17.0) | MWC | H | 74-89 | L | 0% | 0.0 |
| 11-21 | Air Force (253.0) | MWC | A | 71-83 | W | 100% | 0.0 |
| 11-24 | Arkansas Pine Bluff (307.0) | SWAC | H | 78-69 | W | 100% | 0.0 |
| 11-25 | Texas St. (243.0) | SB | H | 78-85 | L | 0% | 0.0 |
| 11-26 | Canisius (124.0) | MAAC | H | 80-58 | W | 100% | 0.0 |
| 11-30 | UC Riverside (300.0) | BW | A | 55-57 | W | 100% | 0.0 |
| 12-6 | UC Davis (102.0) | BW | A | 71-67 | L | 0% | 0.0 |
| 12-9 | Wyoming (98.0) | MWC | A | 86-72 | L | 0% | 0.0 |
| 12-16 | UNLV (134.0) | MWC | H | 76-81 | L | 0% | 0.0 |
| 12-22 | Arizona St. (66.0) | P12 | A | 104-65 | L | 0% | 0.0 |
| 12-28 | Gonzaga (21.0) | WCC | A | 81-48 | L | 0% | 0.0 |
| 12-30 | Loyola Marymount (258.0) | WCC | H | 88-82 | W | 100% | 0.0 |
| 1-4 | Saint Mary's (40.0) | WCC | A | 74-56 | L | 0% | 0.0 |
| 1-6 | BYU (67.0) | WCC | H | 67-66 | W | 100% | 0.0 |
| 1-11 | San Diego (143.0) | WCC | H | 74-70 | W | 100% | 0.0 |
| 1-13 | Portland (285.0) | WCC | A | 54-66 | W | 100% | 0.0 |
| 1-18 | Pepperdine (317.0) | WCC | H | 92-78 | W | 100% | 0.0 |
| 1-20 | Saint Mary's (40.0) | WCC | H | 69-72 | L | 0% | 0.0 |
| 1-25 | San Francisco (139.0) | WCC | A | 69-67 | L | 0% | 0.0 |
| 1-27 | BYU (67.0) | WCC | A | 80-65 | L | 0% | 0.0 |
| 2-1 | Santa Clara (264.0) | WCC | A | 45-63 | W | 100% | 0.0 |
| 2-3 | Pepperdine (317.0) | WCC | A | 72-81 | W | 100% | 0.0 |
| 2-8 | Gonzaga (21.0) | WCC | H | 61-71 | L | 0% | 0.0 |
| 2-10 | Portland (285.0) | WCC | H | 60-58 | W | 100% | 0.0 |
| 2-15 | San Diego (143.0) | WCC | A | 55-67 | W | 100% | 0.0 |
| 2-17 | Santa Clara (264.0) | WCC | H | 68-72 | L | 0% | 0.0 |
| 2-22 | San Francisco (139.0) | WCC | H | 74-84 | L | 0% | 0.0 |
| 2-24 | Loyola Marymount (258.0) | WCC | A | 74-71 | L | 0% | 0.0 |
| 3-3 | San Francisco (139.0) | WCC | N | 71-70 | L | 0% | 0.0 |
| Team | Conf | Curr Wgt | Fut Wgt | Curr W/L | Exp W/L | Curr Impact | Exp Impact |
|---|---|---|---|---|---|---|---|
| Pacific | WCC | 26.42 | 26.42 | 41.72 | 41.72 | -4.37 | -4.37 |
| San Francisco | WCC | 5.84 | 5.84 | 48.28 | 48.28 | -0.20 | -0.20 |
| Gonzaga | WCC | 4.29 | 4.29 | 87.50 | 87.50 | 3.22 | 3.22 |
| BYU | WCC | 4.26 | 4.26 | 71.88 | 71.88 | 1.86 | 1.86 |
| Pepperdine | WCC | 4.23 | 4.23 | 17.24 | 17.24 | -2.77 | -2.77 |
| Loyola Marymount | WCC | 4.23 | 4.23 | 32.14 | 32.14 | -1.51 | -1.51 |
| Saint Mary's | WCC | 4.21 | 4.21 | 83.87 | 83.87 | 2.85 | 2.85 |
| Santa Clara | WCC | 4.19 | 4.19 | 33.33 | 33.33 | -1.40 | -1.40 |
| Portland | WCC | 4.15 | 4.15 | 25.93 | 25.93 | -2.00 | -2.00 |
| San Diego | WCC | 4.15 | 4.15 | 60.71 | 60.71 | 0.89 | 0.89 |
| UC Davis | BW | 3.41 | 3.41 | 64.29 | 64.29 | 0.97 | 0.97 |
| Nevada | MWC | 1.95 | 1.95 | 78.79 | 78.79 | 1.12 | 1.12 |
| UC Riverside | BW | 1.91 | 1.91 | 25.00 | 25.00 | -0.95 | -0.95 |
| Air Force | MWC | 1.84 | 1.84 | 35.71 | 35.71 | -0.52 | -0.52 |
| UNLV | MWC | 1.79 | 1.79 | 59.38 | 59.38 | 0.34 | 0.34 |
| Arkansas Pine Bluff | SWAC | 1.75 | 1.75 | 41.18 | 41.18 | -0.31 | -0.31 |
| Stanford | P12 | 1.74 | 1.74 | 53.12 | 53.12 | 0.11 | 0.11 |
| Arizona St. | P12 | 1.74 | 1.74 | 63.33 | 63.33 | 0.46 | 0.46 |
| Wyoming | MWC | 1.71 | 1.71 | 58.06 | 58.06 | 0.28 | 0.28 |
| Canisius | MAAC | 1.69 | 1.69 | 67.74 | 67.74 | 0.60 | 0.60 |
| Texas St. | SB | 1.69 | 1.69 | 40.00 | 40.00 | -0.34 | -0.34 |
| San Jose St. | MWC | 0.44 | 0.44 | 10.34 | 10.34 | -0.35 | -0.35 |
| Cal St. Fullerton | BW | 0.38 | 0.38 | 62.07 | 62.07 | 0.09 | 0.09 |
| San Diego St. | MWC | 0.35 | 0.35 | 67.74 | 67.74 | 0.13 | 0.13 |
| UC Santa Barbara | BW | 0.34 | 0.34 | 70.00 | 70.00 | 0.14 | 0.14 |
| Long Beach St. | BW | 0.32 | 0.32 | 41.94 | 41.94 | -0.05 | -0.05 |
| Boise St. | MWC | 0.31 | 0.31 | 73.33 | 73.33 | 0.15 | 0.15 |
| Utah St. | MWC | 0.30 | 0.30 | 48.48 | 48.48 | -0.01 | -0.01 |
| Cal Poly | BW | 0.30 | 0.30 | 24.14 | 24.14 | -0.15 | -0.15 |
| UC Irvine | BW | 0.26 | 0.26 | 48.48 | 48.48 | -0.01 | -0.01 |
| Sacramento St. | BSky | 0.23 | 0.23 | 16.67 | 16.67 | -0.16 | -0.16 |
| Washington | P12 | 0.23 | 0.23 | 62.50 | 62.50 | 0.06 | 0.06 |
| Fresno St. | MWC | 0.23 | 0.23 | 63.33 | 63.33 | 0.06 | 0.06 |
| Portland St. | BSky | 0.22 | 0.22 | 56.67 | 56.67 | 0.03 | 0.03 |
| Cal St. Northridge | BW | 0.22 | 0.22 | 14.29 | 14.29 | -0.15 | -0.15 |
| Hawaii | BW | 0.21 | 0.21 | 53.57 | 53.57 | 0.01 | 0.01 |
| Northern Colorado | BSky | 0.21 | 0.21 | 61.29 | 61.29 | 0.05 | 0.05 |
| Colorado St. | MWC | 0.20 | 0.20 | 32.26 | 32.26 | -0.07 | -0.07 |
| New Mexico | MWC | 0.20 | 0.20 | 54.55 | 54.55 | 0.02 | 0.02 |
| California | P12 | 0.20 | 0.20 | 25.81 | 25.81 | -0.10 | -0.10 |
| Texas Southern | SWAC | 0.19 | 0.19 | 44.12 | 44.12 | -0.02 | -0.02 |
| Colorado | P12 | 0.18 | 0.18 | 53.12 | 53.12 | 0.01 | 0.01 |
| Oregon St. | P12 | 0.18 | 0.18 | 50.00 | 50.00 | 0.00 | 0.00 |
| Washington St. | P12 | 0.18 | 0.18 | 38.71 | 38.71 | -0.04 | -0.04 |
| UT Arlington | SB | 0.15 | 0.15 | 60.61 | 60.61 | 0.03 | 0.03 |
| Radford | BSth | 0.15 | 0.15 | 62.50 | 62.50 | 0.04 | 0.04 |
| Eastern Washington | BSky | 0.15 | 0.15 | 56.25 | 56.25 | 0.02 | 0.02 |
| Utah | P12 | 0.15 | 0.15 | 63.33 | 63.33 | 0.04 | 0.04 |
| Mississippi Valley St. | SWAC | 0.14 | 0.14 | 12.50 | 12.50 | -0.11 | -0.11 |
| Northern Arizona | BSky | 0.14 | 0.14 | 13.33 | 13.33 | -0.10 | -0.10 |
| Seattle | WAC | 0.13 | 0.13 | 56.67 | 56.67 | 0.02 | 0.02 |
| USC | P12 | 0.13 | 0.13 | 67.65 | 67.65 | 0.05 | 0.05 |
| Utah Valley | WAC | 0.13 | 0.13 | 65.52 | 65.52 | 0.04 | 0.04 |
| Arizona | P12 | 0.13 | 0.13 | 79.41 | 79.41 | 0.07 | 0.07 |
| St. Francis PA | NEC | 0.12 | 0.12 | 57.14 | 57.14 | 0.02 | 0.02 |
| Weber St. | BSky | 0.12 | 0.12 | 60.71 | 60.71 | 0.03 | 0.03 |
| Louisiana Lafayette | SB | 0.10 | 0.10 | 80.65 | 80.65 | 0.06 | 0.06 |
| New Mexico St. | WAC | 0.10 | 0.10 | 83.33 | 83.33 | 0.07 | 0.07 |
| Incarnate Word | Slnd | 0.10 | 0.10 | 12.50 | 12.50 | -0.08 | -0.08 |
| UCLA | P12 | 0.10 | 0.10 | 65.62 | 65.62 | 0.03 | 0.03 |
| Niagara | MAAC | 0.10 | 0.10 | 59.38 | 59.38 | 0.02 | 0.02 |
| Valparaiso | MVC | 0.08 | 0.08 | 43.33 | 43.33 | -0.01 | -0.01 |
| Grand Canyon | WAC | 0.08 | 0.08 | 65.62 | 65.62 | 0.03 | 0.03 |
| North Carolina | ACC | 0.08 | 0.08 | 71.43 | 71.43 | 0.03 | 0.03 |
| Little Rock | SB | 0.08 | 0.08 | 20.00 | 20.00 | -0.05 | -0.05 |
| Idaho | BSky | 0.08 | 0.08 | 68.97 | 68.97 | 0.03 | 0.03 |
| Robert Morris | NEC | 0.08 | 0.08 | 48.48 | 48.48 | -0.00 | -0.00 |
| Coastal Carolina | SB | 0.08 | 0.08 | 37.93 | 37.93 | -0.02 | -0.02 |
| Denver | Sum | 0.08 | 0.08 | 46.43 | 46.43 | -0.01 | -0.01 |
| Oral Roberts | Sum | 0.08 | 0.08 | 28.57 | 28.57 | -0.03 | -0.03 |
| Oregon | P12 | 0.08 | 0.08 | 64.71 | 64.71 | 0.02 | 0.02 |
| Southern Utah | BSky | 0.08 | 0.08 | 36.67 | 36.67 | -0.02 | -0.02 |
| Central Arkansas | Slnd | 0.08 | 0.08 | 50.00 | 50.00 | 0.00 | 0.00 |
| Duquesne | A10 | 0.08 | 0.08 | 50.00 | 50.00 | 0.00 | 0.00 |
| Quinnipiac | MAAC | 0.08 | 0.08 | 36.36 | 36.36 | -0.02 | -0.02 |
| Idaho St. | BSky | 0.07 | 0.07 | 42.86 | 42.86 | -0.01 | -0.01 |
| Florida | SEC | 0.07 | 0.07 | 62.50 | 62.50 | 0.02 | 0.02 |
| Ohio St. | B10 | 0.07 | 0.07 | 75.00 | 75.00 | 0.04 | 0.04 |
| Illinois St. | MVC | 0.07 | 0.07 | 53.12 | 53.12 | 0.00 | 0.00 |
| Prairie View A&M | SWAC | 0.07 | 0.07 | 45.45 | 45.45 | -0.01 | -0.01 |
| North Dakota | BSky | 0.07 | 0.07 | 33.33 | 33.33 | -0.02 | -0.02 |
| Southern | SWAC | 0.07 | 0.07 | 41.94 | 41.94 | -0.01 | -0.01 |
| DePaul | BE | 0.06 | 0.06 | 35.48 | 35.48 | -0.02 | -0.02 |
| Hartford | AE | 0.06 | 0.06 | 58.06 | 58.06 | 0.01 | 0.01 |
| Oklahoma | B12 | 0.06 | 0.06 | 58.06 | 58.06 | 0.01 | 0.01 |
| Sam Houston St. | Slnd | 0.06 | 0.06 | 51.72 | 51.72 | 0.00 | 0.00 |
| Abilene Christian | Slnd | 0.05 | 0.05 | 44.44 | 44.44 | -0.01 | -0.01 |
| Lamar | Slnd | 0.05 | 0.05 | 53.57 | 53.57 | 0.00 | 0.00 |
| McNeese St. | Slnd | 0.05 | 0.05 | 32.00 | 32.00 | -0.02 | -0.02 |
| Norfolk St. | MEAC | 0.05 | 0.05 | 43.33 | 43.33 | -0.01 | -0.01 |
| North Texas | CUSA | 0.05 | 0.05 | 43.33 | 43.33 | -0.01 | -0.01 |
| Montana | BSky | 0.05 | 0.05 | 77.42 | 77.42 | 0.03 | 0.03 |
| Appalachian St. | SB | 0.05 | 0.05 | 41.94 | 41.94 | -0.01 | -0.01 |
| Belmont | OVC | 0.05 | 0.05 | 72.73 | 72.73 | 0.02 | 0.02 |
| Georgia Southern | SB | 0.05 | 0.05 | 61.29 | 61.29 | 0.01 | 0.01 |
| Georgia St. | SB | 0.05 | 0.05 | 68.75 | 68.75 | 0.02 | 0.02 |
| Louisiana Monroe | SB | 0.05 | 0.05 | 46.43 | 46.43 | -0.00 | -0.00 |
| Oklahoma St. | B12 | 0.05 | 0.05 | 57.58 | 57.58 | 0.01 | 0.01 |
| Texas A&M | SEC | 0.05 | 0.05 | 62.50 | 62.50 | 0.01 | 0.01 |
| Kansas | B12 | 0.05 | 0.05 | 79.41 | 79.41 | 0.03 | 0.03 |
| Rice | CUSA | 0.05 | 0.05 | 17.24 | 17.24 | -0.03 | -0.03 |
| Iona | MAAC | 0.05 | 0.05 | 60.61 | 60.61 | 0.01 | 0.01 |
| Marist | MAAC | 0.05 | 0.05 | 19.35 | 19.35 | -0.03 | -0.03 |
| Monmouth | MAAC | 0.05 | 0.05 | 35.48 | 35.48 | -0.01 | -0.01 |
| Rider | MAAC | 0.05 | 0.05 | 70.97 | 70.97 | 0.02 | 0.02 |
| Saint Peter's | MAAC | 0.05 | 0.05 | 43.75 | 43.75 | -0.01 | -0.01 |
| Siena | MAAC | 0.05 | 0.05 | 25.00 | 25.00 | -0.03 | -0.03 |
| Troy | SB | 0.05 | 0.05 | 45.16 | 45.16 | -0.00 | -0.00 |
| Dayton | A10 | 0.05 | 0.05 | 45.16 | 45.16 | -0.00 | -0.00 |
| Georgia | SEC | 0.05 | 0.05 | 54.55 | 54.55 | 0.00 | 0.00 |
| Harvard | Ivy | 0.05 | 0.05 | 56.67 | 56.67 | 0.01 | 0.01 |
| UNC Asheville | BSth | 0.05 | 0.05 | 61.29 | 61.29 | 0.01 | 0.01 |
| Cincinnati | Amer | 0.05 | 0.05 | 88.24 | 88.24 | 0.04 | 0.04 |
| Alabama | SEC | 0.05 | 0.05 | 55.88 | 55.88 | 0.01 | 0.01 |
| Creighton | BE | 0.05 | 0.05 | 64.52 | 64.52 | 0.01 | 0.01 |
| Howard | MEAC | 0.05 | 0.05 | 25.81 | 25.81 | -0.02 | -0.02 |
| IUPUI | Horz | 0.05 | 0.05 | 32.14 | 32.14 | -0.02 | -0.02 |
| Massachusetts | A10 | 0.05 | 0.05 | 39.39 | 39.39 | -0.01 | -0.01 |
| Princeton | Ivy | 0.05 | 0.05 | 42.86 | 42.86 | -0.01 | -0.01 |
| Texas | B12 | 0.05 | 0.05 | 57.58 | 57.58 | 0.01 | 0.01 |
| Villanova | BE | 0.05 | 0.05 | 88.24 | 88.24 | 0.04 | 0.04 |
| Alabama A&M | SWAC | 0.05 | 0.05 | 9.68 | 9.68 | -0.04 | -0.04 |
| Alabama St. | SWAC | 0.05 | 0.05 | 25.81 | 25.81 | -0.02 | -0.02 |
| Alcorn St. | SWAC | 0.05 | 0.05 | 25.00 | 25.00 | -0.02 | -0.02 |
| Grambling St. | SWAC | 0.05 | 0.05 | 53.33 | 53.33 | 0.00 | 0.00 |
| Jackson St. | SWAC | 0.05 | 0.05 | 33.33 | 33.33 | -0.02 | -0.02 |
| Army | Pat | 0.03 | 0.03 | 41.38 | 41.38 | -0.00 | -0.00 |
| Indiana St. | MVC | 0.03 | 0.03 | 37.93 | 37.93 | -0.01 | -0.01 |
| Michigan | B10 | 0.03 | 0.03 | 79.41 | 79.41 | 0.02 | 0.02 |
| Arkansas St. | SB | 0.03 | 0.03 | 30.00 | 30.00 | -0.01 | -0.01 |
| Houston Baptist | Slnd | 0.03 | 0.03 | 10.71 | 10.71 | -0.02 | -0.02 |
| Kansas St. | B12 | 0.03 | 0.03 | 66.67 | 66.67 | 0.01 | 0.01 |
| Longwood | BSth | 0.03 | 0.03 | 13.33 | 13.33 | -0.02 | -0.02 |
| South Alabama | SB | 0.03 | 0.03 | 40.00 | 40.00 | -0.01 | -0.01 |
| St. John's | BE | 0.03 | 0.03 | 46.88 | 46.88 | -0.00 | -0.00 |
| Texas A&M Corpus Chris | Slnd | 0.03 | 0.03 | 30.77 | 30.77 | -0.01 | -0.01 |
| UT Rio Grande Valley | WAC | 0.03 | 0.03 | 43.33 | 43.33 | -0.00 | -0.00 |
| UTSA | CUSA | 0.03 | 0.03 | 53.33 | 53.33 | 0.00 | 0.00 |
| Vanderbilt | SEC | 0.03 | 0.03 | 37.50 | 37.50 | -0.01 | -0.01 |
| Xavier | BE | 0.03 | 0.03 | 84.85 | 84.85 | 0.02 | 0.02 |
| Albany | AE | 0.03 | 0.03 | 67.74 | 67.74 | 0.01 | 0.01 |
| Buffalo | MAC | 0.03 | 0.03 | 75.76 | 75.76 | 0.01 | 0.01 |
| Chattanooga | SC | 0.03 | 0.03 | 25.81 | 25.81 | -0.01 | -0.01 |
| Dartmouth | Ivy | 0.03 | 0.03 | 23.08 | 23.08 | -0.01 | -0.01 |
| Drake | MVC | 0.03 | 0.03 | 48.39 | 48.39 | -0.00 | -0.00 |
| Elon | CAA | 0.03 | 0.03 | 40.00 | 40.00 | -0.01 | -0.01 |
| Evansville | MVC | 0.03 | 0.03 | 50.00 | 50.00 | 0.00 | 0.00 |
| Fairfield | MAAC | 0.03 | 0.03 | 51.52 | 51.52 | 0.00 | 0.00 |
| Manhattan | MAAC | 0.03 | 0.03 | 45.16 | 45.16 | -0.00 | -0.00 |
| South Carolina | SEC | 0.03 | 0.03 | 50.00 | 50.00 | 0.00 | 0.00 |
| South Dakota St. | Sum | 0.03 | 0.03 | 80.00 | 80.00 | 0.02 | 0.02 |
| St. Bonaventure | A10 | 0.03 | 0.03 | 78.12 | 78.12 | 0.01 | 0.01 |
| Tennessee St. | OVC | 0.03 | 0.03 | 46.43 | 46.43 | -0.00 | -0.00 |
| Youngstown St. | Horz | 0.03 | 0.03 | 20.00 | 20.00 | -0.02 | -0.02 |
| Florida A&M | MEAC | 0.02 | 0.02 | 24.24 | 24.24 | -0.01 | -0.01 |
| Illinois | B10 | 0.02 | 0.02 | 41.94 | 41.94 | -0.00 | -0.00 |
| Northeastern | CAA | 0.02 | 0.02 | 68.75 | 68.75 | 0.01 | 0.01 |
| Northern Iowa | MVC | 0.02 | 0.02 | 46.67 | 46.67 | -0.00 | -0.00 |
| Davidson | A10 | 0.02 | 0.02 | 65.62 | 65.62 | 0.01 | 0.01 |
| Rhode Island | A10 | 0.02 | 0.02 | 78.12 | 78.12 | 0.01 | 0.01 |
| Southern Illinois | MVC | 0.02 | 0.02 | 59.38 | 59.38 | 0.00 | 0.00 |
| TCU | B12 | 0.02 | 0.02 | 65.62 | 65.62 | 0.01 | 0.01 |
| Texas Tech | B12 | 0.02 | 0.02 | 72.73 | 72.73 | 0.01 | 0.01 |
| SMU | Amer | 0.02 | 0.02 | 51.52 | 51.52 | 0.00 | 0.00 |
| Tennessee Martin | OVC | 0.02 | 0.02 | 27.59 | 27.59 | -0.01 | -0.01 |