
 - Blog
| Conference: | ASun |
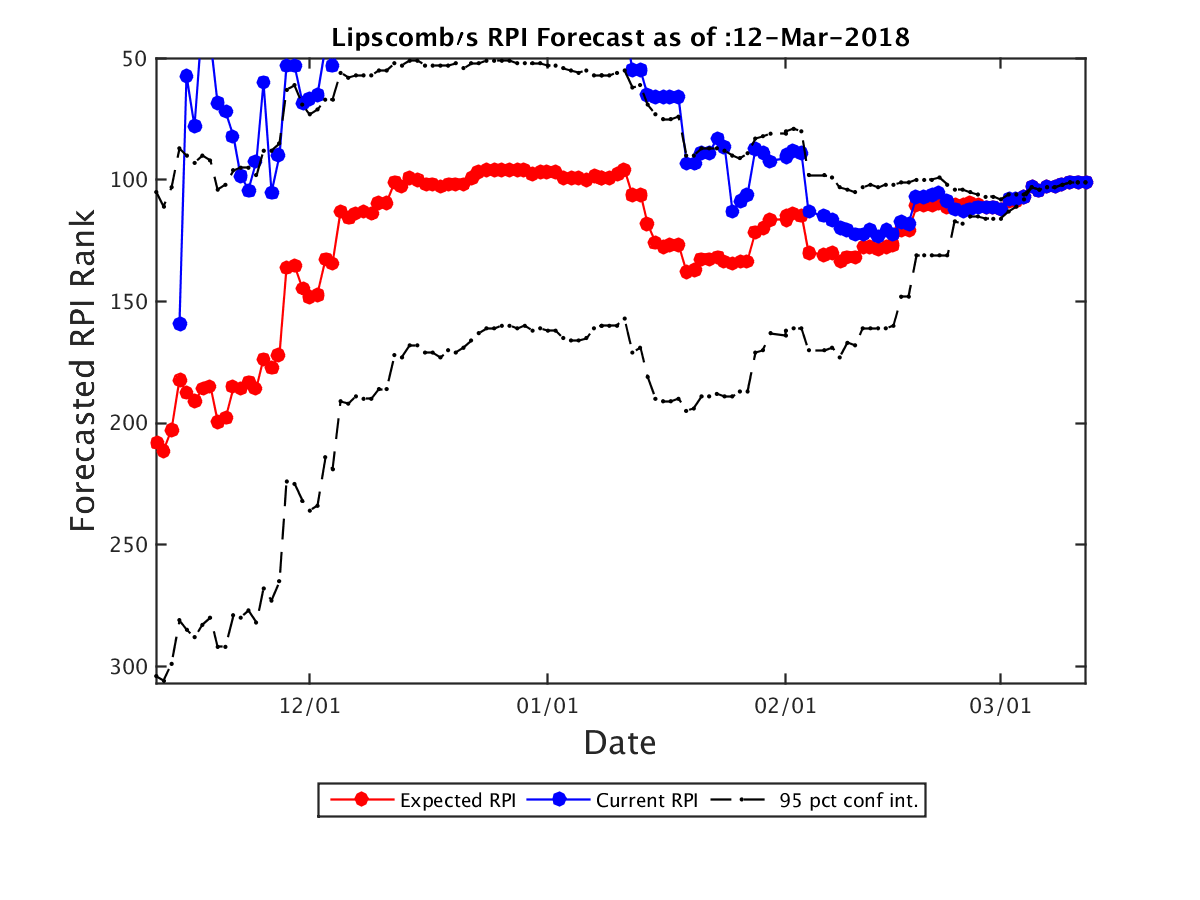
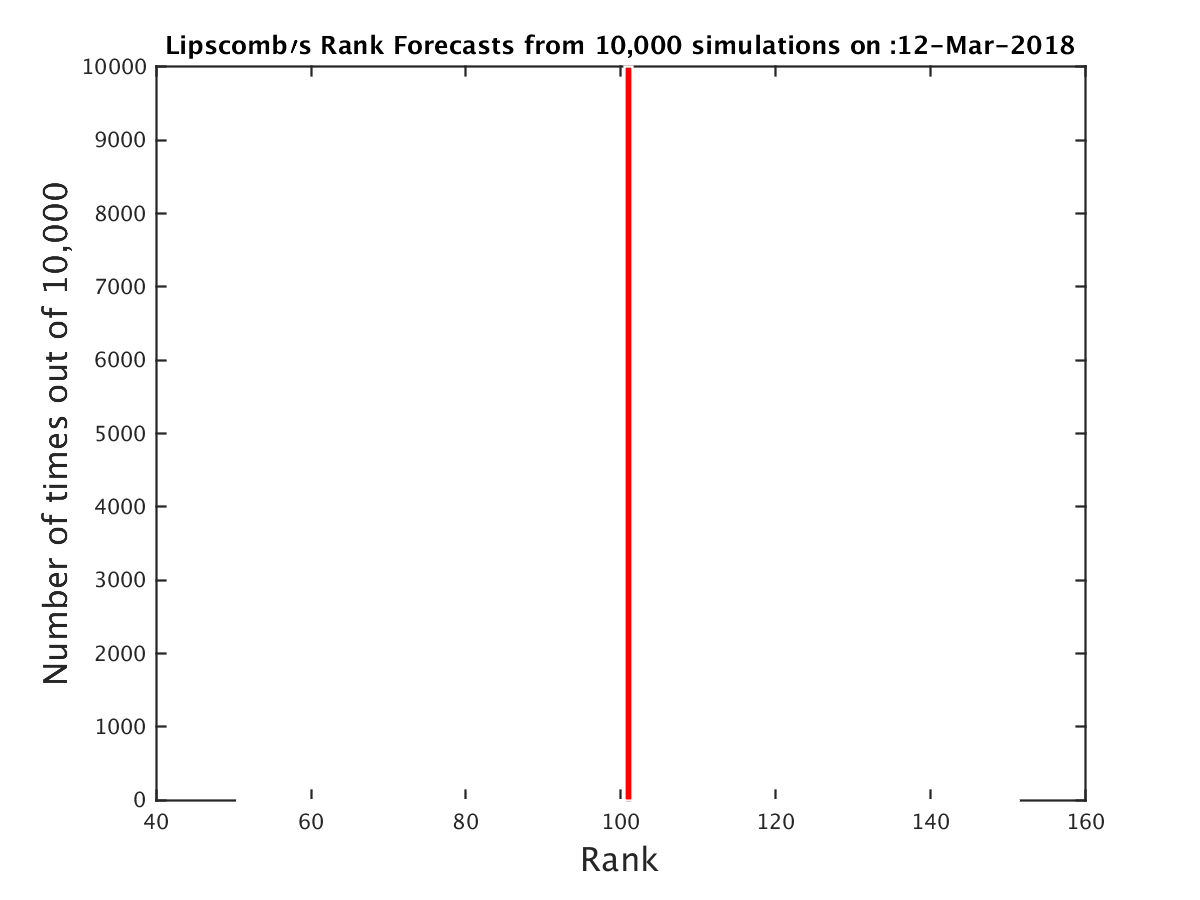
| Expected RPI: | 101.0 |
| Current RPI: | 101 |
| Expected SOS: | 232 |
| Current SOS: | 232 |
| Current Record: | 20-9 |
| Expected Record: | 20-9 |
| Current Conf Record: | 13-4 |
| Expected Conf Record: | 13-4 |
| Expected Record vs RPI 1-25: | 0-2 |
| Expected Record vs RPI 26-50: | 0-1 |
| Expected Record vs RPI 51-100: | 2-1 |
| Expected Record vs RPI 101-200: | 4-2 |
| Expected Record vs RPI 200+: | 14-3 |
| Current OOC Record: | 7-5 |
| Expected OOC Record: | 7-5 |
| Expected OOC RPI: | 24 |
| Expected OOC SOS: | 31 |
| Final Record | Expected RPI | Probability |
|---|---|---|
| 20-9 | 101.0 | 100.00% |
| Date | Opponent (Expected RPI) | Conf | Location | Score | Outcome | Prob(W) | Spread |
|---|---|---|---|---|---|---|---|
| 11-12 | Morehead St. (292.0) | OVC | H | 77-70 | W | 100% | 0.0 |
| 11-14 | Alabama (42.0) | SEC | A | 86-64 | L | 0% | 0.0 |
| 11-18 | Texas (51.0) | B12 | A | 80-57 | L | 0% | 0.0 |
| 11-20 | Abilene Christian (260.0) | Slnd | A | 67-75 | W | 100% | 0.0 |
| 11-27 | Belmont (81.0) | OVC | A | 66-74 | W | 100% | 0.0 |
| 11-29 | Tennessee Tech (158.0) | OVC | A | 86-80 | L | 0% | 0.0 |
| 12-2 | Tennessee St. (189.0) | OVC | A | 86-95 | W | 100% | 0.0 |
| 12-4 | Belmont (81.0) | OVC | H | 69-54 | W | 100% | 0.0 |
| 12-9 | Tennessee (8.0) | SEC | A | 81-71 | L | 0% | 0.0 |
| 12-17 | Abilene Christian (260.0) | Slnd | H | 67-65 | W | 100% | 0.0 |
| 12-21 | Navy (200.0) | Pat | A | 64-73 | W | 100% | 0.0 |
| 12-30 | Purdue (9.0) | B10 | A | 98-66 | L | 0% | 0.0 |
| 1-6 | Kennesaw St. (301.0) | ASun | A | 71-86 | W | 100% | 0.0 |
| 1-11 | North Florida (218.0) | ASun | A | 102-96 | L | 0% | 0.0 |
| 1-13 | Jacksonville (286.0) | ASun | A | 87-69 | L | 0% | 0.0 |
| 1-18 | Florida Gulf Coast (172.0) | ASun | H | 83-88 | L | 0% | 0.0 |
| 1-20 | Stetson (325.0) | ASun | H | 85-82 | W | 100% | 0.0 |
| 1-24 | USC Upstate (344.0) | ASun | H | 92-78 | W | 100% | 0.0 |
| 1-27 | NJIT (269.0) | ASun | A | 79-86 | W | 100% | 0.0 |
| 1-29 | USC Upstate (344.0) | ASun | A | 106-110 | W | 100% | 0.0 |
| 2-3 | NJIT (269.0) | ASun | H | 77-81 | L | 0% | 0.0 |
| 2-8 | Jacksonville (286.0) | ASun | H | 82-59 | W | 100% | 0.0 |
| 2-10 | North Florida (218.0) | ASun | H | 82-75 | W | 100% | 0.0 |
| 2-15 | Stetson (325.0) | ASun | A | 73-82 | W | 100% | 0.0 |
| 2-17 | Florida Gulf Coast (172.0) | ASun | A | 87-90 | W | 100% | 0.0 |
| 2-22 | Kennesaw St. (301.0) | ASun | H | 83-74 | W | 100% | 0.0 |
| 2-26 | Stetson (325.0) | ASun | H | 89-73 | W | 100% | 0.0 |
| 3-1 | Jacksonville (286.0) | ASun | N | 77-62 | W | 100% | 0.0 |
| 3-4 | Florida Gulf Coast (172.0) | ASun | A | 96-108 | W | 100% | 0.0 |
| Team | Conf | Curr Wgt | Fut Wgt | Curr W/L | Exp W/L | Curr Impact | Exp Impact |
|---|---|---|---|---|---|---|---|
| Lipscomb | ASun | 26.73 | 26.73 | 74.45 | 74.45 | 13.07 | 13.07 |
| Florida Gulf Coast | ASun | 6.17 | 6.17 | 67.86 | 67.86 | 2.20 | 2.20 |
| Jacksonville | ASun | 6.07 | 6.07 | 38.46 | 38.46 | -1.40 | -1.40 |
| Stetson | ASun | 6.00 | 6.00 | 32.00 | 32.00 | -2.16 | -2.16 |
| North Florida | ASun | 4.49 | 4.49 | 35.71 | 35.71 | -1.28 | -1.28 |
| Kennesaw St. | ASun | 4.49 | 4.49 | 30.77 | 30.77 | -1.73 | -1.73 |
| USC Upstate | ASun | 4.49 | 4.49 | 11.54 | 11.54 | -3.45 | -3.45 |
| NJIT | ASun | 4.40 | 4.40 | 42.31 | 42.31 | -0.68 | -0.68 |
| Belmont | OVC | 3.63 | 3.63 | 77.42 | 77.42 | 1.99 | 1.99 |
| Abilene Christian | Slnd | 3.51 | 3.51 | 48.00 | 48.00 | -0.14 | -0.14 |
| Tennessee St. | OVC | 2.06 | 2.06 | 48.15 | 48.15 | -0.08 | -0.08 |
| Tennessee Tech | OVC | 2.02 | 2.02 | 53.33 | 53.33 | 0.13 | 0.13 |
| Morehead St. | OVC | 1.95 | 1.95 | 23.08 | 23.08 | -1.05 | -1.05 |
| Navy | Pat | 1.81 | 1.81 | 63.33 | 63.33 | 0.48 | 0.48 |
| Purdue | B10 | 1.78 | 1.78 | 81.82 | 81.82 | 1.13 | 1.13 |
| Texas | B12 | 1.78 | 1.78 | 56.25 | 56.25 | 0.22 | 0.22 |
| Alabama | SEC | 1.78 | 1.78 | 54.55 | 54.55 | 0.16 | 0.16 |
| Tennessee | SEC | 1.77 | 1.77 | 75.00 | 75.00 | 0.89 | 0.89 |
| Jacksonville St. | OVC | 0.37 | 0.37 | 62.50 | 62.50 | 0.09 | 0.09 |
| Eastern Kentucky | OVC | 0.37 | 0.37 | 31.03 | 31.03 | -0.14 | -0.14 |
| SIU Edwardsville | OVC | 0.37 | 0.37 | 30.00 | 30.00 | -0.15 | -0.15 |
| Eastern Illinois | OVC | 0.26 | 0.26 | 34.48 | 34.48 | -0.08 | -0.08 |
| Middle Tennessee | CUSA | 0.25 | 0.25 | 76.67 | 76.67 | 0.13 | 0.13 |
| Michigan | B10 | 0.25 | 0.25 | 79.41 | 79.41 | 0.15 | 0.15 |
| Bethune Cookman | MEAC | 0.24 | 0.24 | 53.33 | 53.33 | 0.02 | 0.02 |
| FIU | CUSA | 0.23 | 0.23 | 37.93 | 37.93 | -0.06 | -0.06 |
| Austin Peay | OVC | 0.22 | 0.22 | 53.33 | 53.33 | 0.01 | 0.01 |
| Murray St. | OVC | 0.22 | 0.22 | 82.76 | 82.76 | 0.15 | 0.15 |
| Campbell | BSth | 0.22 | 0.22 | 46.43 | 46.43 | -0.02 | -0.02 |
| Bowling Green | MAC | 0.21 | 0.21 | 46.67 | 46.67 | -0.01 | -0.01 |
| Texas Tech | B12 | 0.20 | 0.20 | 72.73 | 72.73 | 0.09 | 0.09 |
| Central Arkansas | Slnd | 0.19 | 0.19 | 50.00 | 50.00 | 0.00 | 0.00 |
| Southeast Missouri St. | OVC | 0.17 | 0.17 | 41.38 | 41.38 | -0.03 | -0.03 |
| Tennessee Martin | OVC | 0.17 | 0.17 | 27.59 | 27.59 | -0.08 | -0.08 |
| Denver | Sum | 0.17 | 0.17 | 46.43 | 46.43 | -0.01 | -0.01 |
| Mississippi St. | SEC | 0.16 | 0.16 | 65.62 | 65.62 | 0.05 | 0.05 |
| Gardner Webb | BSth | 0.15 | 0.15 | 37.93 | 37.93 | -0.04 | -0.04 |
| Butler | BE | 0.14 | 0.14 | 60.61 | 60.61 | 0.03 | 0.03 |
| Green Bay | Horz | 0.14 | 0.14 | 33.33 | 33.33 | -0.05 | -0.05 |
| Milwaukee | Horz | 0.14 | 0.14 | 48.39 | 48.39 | -0.00 | -0.00 |
| Georgia | SEC | 0.14 | 0.14 | 54.55 | 54.55 | 0.01 | 0.01 |
| Minnesota | B10 | 0.14 | 0.14 | 46.88 | 46.88 | -0.01 | -0.01 |
| Rutgers | B10 | 0.14 | 0.14 | 42.42 | 42.42 | -0.02 | -0.02 |
| Florida | SEC | 0.13 | 0.13 | 62.50 | 62.50 | 0.03 | 0.03 |
| LSU | SEC | 0.13 | 0.13 | 54.84 | 54.84 | 0.01 | 0.01 |
| TCU | B12 | 0.13 | 0.13 | 65.62 | 65.62 | 0.04 | 0.04 |
| Vanderbilt | SEC | 0.13 | 0.13 | 37.50 | 37.50 | -0.03 | -0.03 |
| Kentucky | SEC | 0.13 | 0.13 | 70.59 | 70.59 | 0.05 | 0.05 |
| Incarnate Word | Slnd | 0.13 | 0.13 | 12.50 | 12.50 | -0.10 | -0.10 |
| Sam Houston St. | Slnd | 0.13 | 0.13 | 51.72 | 51.72 | 0.00 | 0.00 |
| Southeastern Louisiana | Slnd | 0.13 | 0.13 | 63.33 | 63.33 | 0.03 | 0.03 |
| Stephen F. Austin | Slnd | 0.13 | 0.13 | 80.00 | 80.00 | 0.08 | 0.08 |
| Texas A&M Corpus Chris | Slnd | 0.13 | 0.13 | 30.77 | 30.77 | -0.05 | -0.05 |
| North Carolina A&T | MEAC | 0.12 | 0.12 | 56.25 | 56.25 | 0.01 | 0.01 |
| Nebraska | B10 | 0.12 | 0.12 | 68.75 | 68.75 | 0.04 | 0.04 |
| UCF | Amer | 0.12 | 0.12 | 59.38 | 59.38 | 0.02 | 0.02 |
| Colgate | Pat | 0.12 | 0.12 | 58.06 | 58.06 | 0.02 | 0.02 |
| Lafayette | Pat | 0.12 | 0.12 | 30.00 | 30.00 | -0.05 | -0.05 |
| Houston Baptist | Slnd | 0.12 | 0.12 | 10.71 | 10.71 | -0.09 | -0.09 |
| North Carolina St. | ACC | 0.12 | 0.12 | 65.62 | 65.62 | 0.04 | 0.04 |
| Fairfield | MAAC | 0.11 | 0.11 | 51.52 | 51.52 | 0.00 | 0.00 |
| Kansas St. | B12 | 0.11 | 0.11 | 66.67 | 66.67 | 0.04 | 0.04 |
| Seattle | WAC | 0.11 | 0.11 | 56.67 | 56.67 | 0.02 | 0.02 |
| Washington | P12 | 0.11 | 0.11 | 62.50 | 62.50 | 0.03 | 0.03 |
| West Virginia | B12 | 0.11 | 0.11 | 70.59 | 70.59 | 0.05 | 0.05 |
| Mercer | SC | 0.11 | 0.11 | 53.33 | 53.33 | 0.01 | 0.01 |
| St. Francis NY | NEC | 0.11 | 0.11 | 37.93 | 37.93 | -0.03 | -0.03 |
| Missouri | SEC | 0.11 | 0.11 | 61.29 | 61.29 | 0.02 | 0.02 |
| Rhode Island | A10 | 0.11 | 0.11 | 78.12 | 78.12 | 0.06 | 0.06 |
| UT Arlington | SB | 0.11 | 0.11 | 60.61 | 60.61 | 0.02 | 0.02 |
| Iowa St. | B12 | 0.10 | 0.10 | 41.94 | 41.94 | -0.02 | -0.02 |
| Mississippi | SEC | 0.10 | 0.10 | 37.50 | 37.50 | -0.03 | -0.03 |
| Auburn | SEC | 0.10 | 0.10 | 78.12 | 78.12 | 0.06 | 0.06 |
| Texas A&M | SEC | 0.10 | 0.10 | 62.50 | 62.50 | 0.03 | 0.03 |
| Duquesne | A10 | 0.09 | 0.09 | 50.00 | 50.00 | 0.00 | 0.00 |
| Fort Wayne | Sum | 0.09 | 0.09 | 50.00 | 50.00 | 0.00 | 0.00 |
| Marist | MAAC | 0.09 | 0.09 | 19.35 | 19.35 | -0.06 | -0.06 |
| North Dakota St. | Sum | 0.09 | 0.09 | 41.38 | 41.38 | -0.02 | -0.02 |
| South Alabama | SB | 0.09 | 0.09 | 40.00 | 40.00 | -0.02 | -0.02 |
| South Florida | Amer | 0.09 | 0.09 | 31.25 | 31.25 | -0.03 | -0.03 |
| Northwestern St. | Slnd | 0.09 | 0.09 | 8.00 | 8.00 | -0.08 | -0.08 |
| Georgetown | BE | 0.09 | 0.09 | 50.00 | 50.00 | 0.00 | 0.00 |
| Northern Arizona | BSky | 0.09 | 0.09 | 13.33 | 13.33 | -0.07 | -0.07 |
| South Carolina St. | MEAC | 0.09 | 0.09 | 26.67 | 26.67 | -0.04 | -0.04 |
| UAB | CUSA | 0.09 | 0.09 | 58.06 | 58.06 | 0.01 | 0.01 |
| Wright St. | Horz | 0.09 | 0.09 | 71.88 | 71.88 | 0.04 | 0.04 |
| Miami FL | ACC | 0.09 | 0.09 | 70.97 | 70.97 | 0.04 | 0.04 |
| Florida A&M | MEAC | 0.08 | 0.08 | 24.24 | 24.24 | -0.04 | -0.04 |
| VCU | A10 | 0.08 | 0.08 | 54.55 | 54.55 | 0.01 | 0.01 |
| Florida Atlantic | CUSA | 0.08 | 0.08 | 32.14 | 32.14 | -0.03 | -0.03 |
| Holy Cross | Pat | 0.08 | 0.08 | 38.71 | 38.71 | -0.02 | -0.02 |
| Illinois St. | MVC | 0.08 | 0.08 | 53.12 | 53.12 | 0.01 | 0.01 |
| Oral Roberts | Sum | 0.08 | 0.08 | 28.57 | 28.57 | -0.04 | -0.04 |
| Siena | MAAC | 0.08 | 0.08 | 25.00 | 25.00 | -0.04 | -0.04 |
| Wichita St. | Amer | 0.08 | 0.08 | 78.12 | 78.12 | 0.05 | 0.05 |
| Kansas | B12 | 0.08 | 0.08 | 79.41 | 79.41 | 0.05 | 0.05 |
| Michigan St. | B10 | 0.08 | 0.08 | 87.88 | 87.88 | 0.06 | 0.06 |
| Arkansas | SEC | 0.08 | 0.08 | 67.65 | 67.65 | 0.03 | 0.03 |
| Oklahoma | B12 | 0.08 | 0.08 | 58.06 | 58.06 | 0.01 | 0.01 |
| South Carolina | SEC | 0.08 | 0.08 | 50.00 | 50.00 | 0.00 | 0.00 |
| Western Kentucky | CUSA | 0.08 | 0.08 | 69.70 | 69.70 | 0.03 | 0.03 |
| Air Force | MWC | 0.06 | 0.06 | 34.48 | 34.48 | -0.02 | -0.02 |
| Arkansas St. | SB | 0.06 | 0.06 | 30.00 | 30.00 | -0.03 | -0.03 |
| Lamar | Slnd | 0.06 | 0.06 | 53.57 | 53.57 | 0.00 | 0.00 |
| McNeese St. | Slnd | 0.06 | 0.06 | 32.00 | 32.00 | -0.02 | -0.02 |
| New Orleans | Slnd | 0.06 | 0.06 | 42.86 | 42.86 | -0.01 | -0.01 |
| Nicholls St. | Slnd | 0.06 | 0.06 | 60.71 | 60.71 | 0.01 | 0.01 |
| Texas St. | SB | 0.06 | 0.06 | 41.94 | 41.94 | -0.01 | -0.01 |
| Brown | Ivy | 0.06 | 0.06 | 38.46 | 38.46 | -0.01 | -0.01 |
| Buffalo | MAC | 0.06 | 0.06 | 75.76 | 75.76 | 0.03 | 0.03 |
| Charleston Southern | BSth | 0.06 | 0.06 | 42.86 | 42.86 | -0.01 | -0.01 |
| Creighton | BE | 0.06 | 0.06 | 64.52 | 64.52 | 0.02 | 0.02 |
| Drexel | CAA | 0.06 | 0.06 | 37.50 | 37.50 | -0.02 | -0.02 |
| Fairleigh Dickinson | NEC | 0.06 | 0.06 | 37.93 | 37.93 | -0.01 | -0.01 |
| Florida St. | ACC | 0.06 | 0.06 | 64.52 | 64.52 | 0.02 | 0.02 |
| Georgia Southern | SB | 0.06 | 0.06 | 61.29 | 61.29 | 0.01 | 0.01 |
| Hofstra | CAA | 0.06 | 0.06 | 60.00 | 60.00 | 0.01 | 0.01 |
| Iona | MAAC | 0.06 | 0.06 | 60.61 | 60.61 | 0.01 | 0.01 |
| LIU Brooklyn | NEC | 0.06 | 0.06 | 51.52 | 51.52 | 0.00 | 0.00 |
| Samford | SC | 0.06 | 0.06 | 26.67 | 26.67 | -0.03 | -0.03 |
| Seton Hall | BE | 0.06 | 0.06 | 65.62 | 65.62 | 0.02 | 0.02 |
| UMass Lowell | AE | 0.06 | 0.06 | 37.93 | 37.93 | -0.01 | -0.01 |
| UMKC | WAC | 0.06 | 0.06 | 27.59 | 27.59 | -0.03 | -0.03 |
| UNC Asheville | BSth | 0.06 | 0.06 | 61.29 | 61.29 | 0.01 | 0.01 |
| Wagner | NEC | 0.06 | 0.06 | 70.00 | 70.00 | 0.02 | 0.02 |
| Yale | Ivy | 0.06 | 0.06 | 50.00 | 50.00 | 0.00 | 0.00 |
| Ball St. | MAC | 0.06 | 0.06 | 58.06 | 58.06 | 0.01 | 0.01 |
| Eastern Michigan | MAC | 0.06 | 0.06 | 58.62 | 58.62 | 0.01 | 0.01 |
| Mount St. Mary's | NEC | 0.06 | 0.06 | 53.33 | 53.33 | 0.00 | 0.00 |
| Wofford | SC | 0.06 | 0.06 | 60.00 | 60.00 | 0.01 | 0.01 |
| IUPUI | Horz | 0.06 | 0.06 | 32.14 | 32.14 | -0.02 | -0.02 |
| American | Pat | 0.06 | 0.06 | 20.00 | 20.00 | -0.03 | -0.03 |
| Army | Pat | 0.06 | 0.06 | 41.38 | 41.38 | -0.01 | -0.01 |
| Boston University | Pat | 0.06 | 0.06 | 46.67 | 46.67 | -0.00 | -0.00 |
| Bucknell | Pat | 0.06 | 0.06 | 73.53 | 73.53 | 0.03 | 0.03 |
| Lehigh | Pat | 0.06 | 0.06 | 51.72 | 51.72 | 0.00 | 0.00 |
| Loyola MD | Pat | 0.06 | 0.06 | 26.67 | 26.67 | -0.03 | -0.03 |
| Furman | SC | 0.05 | 0.05 | 67.74 | 67.74 | 0.02 | 0.02 |
| Indiana | B10 | 0.05 | 0.05 | 51.61 | 51.61 | 0.00 | 0.00 |
| Baylor | B12 | 0.05 | 0.05 | 54.84 | 54.84 | 0.01 | 0.01 |
| Oklahoma St. | B12 | 0.05 | 0.05 | 57.58 | 57.58 | 0.01 | 0.01 |
| Pepperdine | WCC | 0.05 | 0.05 | 16.13 | 16.13 | -0.04 | -0.04 |
| Providence | BE | 0.05 | 0.05 | 61.76 | 61.76 | 0.01 | 0.01 |
| Louisiana Tech | CUSA | 0.05 | 0.05 | 48.39 | 48.39 | -0.00 | -0.00 |
| Arizona | P12 | 0.05 | 0.05 | 79.41 | 79.41 | 0.03 | 0.03 |
| Maryland | B10 | 0.05 | 0.05 | 58.06 | 58.06 | 0.01 | 0.01 |
| Penn St. | B10 | 0.05 | 0.05 | 61.76 | 61.76 | 0.01 | 0.01 |
| Wisconsin | B10 | 0.05 | 0.05 | 45.45 | 45.45 | -0.00 | -0.00 |
| Marshall | CUSA | 0.03 | 0.03 | 69.70 | 69.70 | 0.01 | 0.01 |
| Northern Kentucky | Horz | 0.03 | 0.03 | 68.97 | 68.97 | 0.01 | 0.01 |
| Virginia Tech | ACC | 0.03 | 0.03 | 65.62 | 65.62 | 0.01 | 0.01 |
| Xavier | BE | 0.03 | 0.03 | 84.85 | 84.85 | 0.02 | 0.02 |
| Alabama St. | SWAC | 0.03 | 0.03 | 25.81 | 25.81 | -0.01 | -0.01 |
| Canisius | MAAC | 0.03 | 0.03 | 65.62 | 65.62 | 0.01 | 0.01 |
| Bryant | NEC | 0.03 | 0.03 | 9.68 | 9.68 | -0.02 | -0.02 |
| Central Michigan | MAC | 0.03 | 0.03 | 53.33 | 53.33 | 0.00 | 0.00 |
| Chattanooga | SC | 0.03 | 0.03 | 25.81 | 25.81 | -0.01 | -0.01 |
| Columbia | Ivy | 0.03 | 0.03 | 26.92 | 26.92 | -0.01 | -0.01 |
| Coppin St. | MEAC | 0.03 | 0.03 | 15.62 | 15.62 | -0.02 | -0.02 |
| Dayton | A10 | 0.03 | 0.03 | 45.16 | 45.16 | -0.00 | -0.00 |
| Delaware | CAA | 0.03 | 0.03 | 38.71 | 38.71 | -0.01 | -0.01 |
| Maryland Eastern Shore | MEAC | 0.03 | 0.03 | 16.67 | 16.67 | -0.02 | -0.02 |
| Morgan St. | MEAC | 0.03 | 0.03 | 36.67 | 36.67 | -0.01 | -0.01 |
| Nebraska Omaha | Sum | 0.03 | 0.03 | 24.14 | 24.14 | -0.01 | -0.01 |
| New Mexico | MWC | 0.03 | 0.03 | 54.55 | 54.55 | 0.00 | 0.00 |
| Penn | Ivy | 0.03 | 0.03 | 74.19 | 74.19 | 0.01 | 0.01 |
| Pittsburgh | ACC | 0.03 | 0.03 | 25.00 | 25.00 | -0.01 | -0.01 |
| Duke | ACC | 0.03 | 0.03 | 78.79 | 78.79 | 0.02 | 0.02 |
| Georgia Tech | ACC | 0.03 | 0.03 | 40.62 | 40.62 | -0.00 | -0.00 |
| Gonzaga | WCC | 0.03 | 0.03 | 88.24 | 88.24 | 0.02 | 0.02 |
| High Point | BSth | 0.03 | 0.03 | 40.74 | 40.74 | -0.00 | -0.00 |
| New Hampshire | AE | 0.03 | 0.03 | 27.59 | 27.59 | -0.01 | -0.01 |
| North Carolina | ACC | 0.03 | 0.03 | 71.43 | 71.43 | 0.01 | 0.01 |
| Presbyterian | BSth | 0.03 | 0.03 | 27.59 | 27.59 | -0.01 | -0.01 |
| Villanova | BE | 0.03 | 0.03 | 88.24 | 88.24 | 0.02 | 0.02 |
| Wake Forest | ACC | 0.03 | 0.03 | 35.48 | 35.48 | -0.01 | -0.01 |
| Alabama A&M | SWAC | 0.03 | 0.03 | 9.68 | 9.68 | -0.02 | -0.02 |
| BYU | WCC | 0.03 | 0.03 | 70.59 | 70.59 | 0.01 | 0.01 |
| Chicago St. | WAC | 0.03 | 0.03 | 3.33 | 3.33 | -0.02 | -0.02 |
| Illinois | B10 | 0.03 | 0.03 | 41.94 | 41.94 | -0.00 | -0.00 |
| Iowa | B10 | 0.03 | 0.03 | 42.42 | 42.42 | -0.00 | -0.00 |
| Louisville | ACC | 0.03 | 0.03 | 60.61 | 60.61 | 0.01 | 0.01 |
| Marquette | BE | 0.03 | 0.03 | 59.38 | 59.38 | 0.00 | 0.00 |
| Memphis | Amer | 0.03 | 0.03 | 61.76 | 61.76 | 0.01 | 0.01 |
| Northwestern | B10 | 0.03 | 0.03 | 45.16 | 45.16 | -0.00 | -0.00 |
| Ohio St. | B10 | 0.03 | 0.03 | 75.00 | 75.00 | 0.01 | 0.01 |
| Valparaiso | MVC | 0.03 | 0.03 | 43.33 | 43.33 | -0.00 | -0.00 |