
 - Blog
| Conference: | WAC |
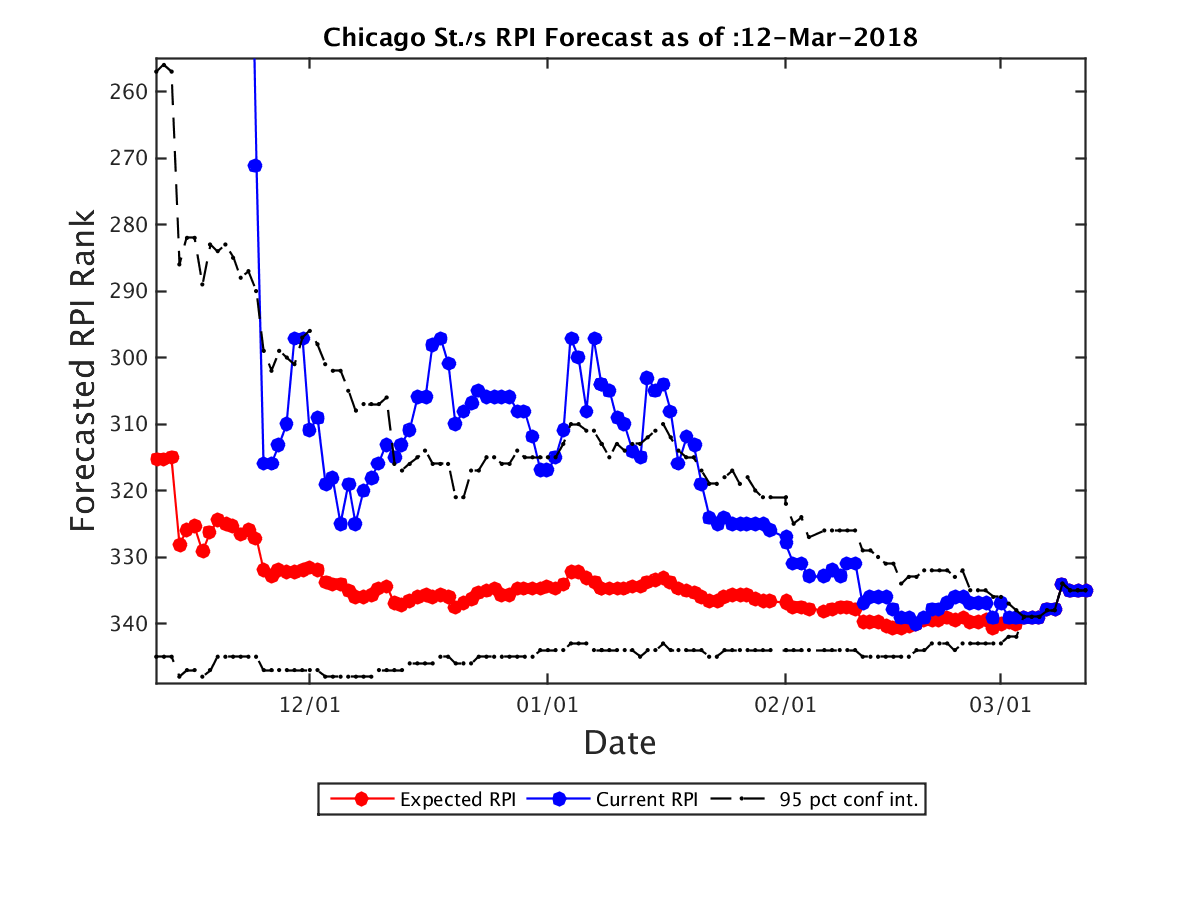
| Expected RPI: | 335.0 |
| Current RPI: | 335 |
| Expected SOS: | 133 |
| Current SOS: | 133 |
| Current Record: | 1-29 |
| Expected Record: | 1-29 |
| Current Conf Record: | 1-14 |
| Expected Conf Record: | 1-14 |
| Expected Record vs RPI 1-25: | 0-1 |
| Expected Record vs RPI 26-50: | 0-3 |
| Expected Record vs RPI 51-100: | 0-4 |
| Expected Record vs RPI 101-200: | 0-13 |
| Expected Record vs RPI 200+: | 1-8 |
| Current OOC Record: | 0-15 |
| Expected OOC Record: | 0-15 |
| Expected OOC RPI: | 339 |
| Expected OOC SOS: | 171 |
| Final Record | Expected RPI | Probability |
|---|---|---|
| 1-29 | 335.0 | 100.00% |
| Date | Opponent (Expected RPI) | Conf | Location | Score | Outcome | Prob(W) | Spread |
|---|---|---|---|---|---|---|---|
| 11-10 | Iowa (157.0) | B10 | A | 95-62 | L | 0% | 0.0 |
| 11-12 | Purdue (9.0) | B10 | A | 111-42 | L | 0% | 0.0 |
| 11-16 | Notre Dame (70.0) | ACC | A | 105-66 | L | 0% | 0.0 |
| 11-18 | Northern Iowa (138.0) | MVC | A | 82-44 | L | 0% | 0.0 |
| 11-23 | UMBC (111.0) | AE | A | 84-73 | L | 0% | 0.0 |
| 11-24 | Presbyterian (319.0) | BSth | N | 75-73 | L | 0% | 0.0 |
| 11-26 | Drake (166.0) | MVC | A | 79-67 | L | 0% | 0.0 |
| 11-29 | Marquette (58.0) | BE | A | 95-69 | L | 0% | 0.0 |
| 12-2 | Northern Illinois (241.0) | MAC | H | 77-95 | L | 0% | 0.0 |
| 12-9 | Oakland (182.0) | Horz | A | 82-50 | L | 0% | 0.0 |
| 12-11 | Northwestern (168.0) | B10 | A | 96-31 | L | 0% | 0.0 |
| 12-16 | Bradley (105.0) | MVC | H | 58-84 | L | 0% | 0.0 |
| 12-19 | SIU Edwardsville (287.0) | OVC | A | 88-76 | L | 0% | 0.0 |
| 12-27 | Wisconsin (114.0) | B10 | A | 82-70 | L | 0% | 0.0 |
| 12-30 | Western Michigan (177.0) | MAC | A | 92-71 | L | 0% | 0.0 |
| 1-6 | New Mexico St. (35.0) | WAC | H | 60-97 | L | 0% | 0.0 |
| 1-11 | Seattle (165.0) | WAC | A | 67-64 | L | 0% | 0.0 |
| 1-13 | Utah Valley (83.0) | WAC | A | 83-58 | L | 0% | 0.0 |
| 1-18 | Grand Canyon (156.0) | WAC | H | 58-86 | L | 0% | 0.0 |
| 1-20 | Cal St. Bakersfield (220.0) | WAC | H | 78-89 | L | 0% | 0.0 |
| 1-27 | UT Rio Grande Valley (229.0) | WAC | H | 81-87 | L | 0% | 0.0 |
| 2-1 | Cal St. Bakersfield (220.0) | WAC | A | 91-61 | L | 0% | 0.0 |
| 2-3 | Grand Canyon (156.0) | WAC | A | 89-55 | L | 0% | 0.0 |
| 2-8 | Utah Valley (83.0) | WAC | H | 57-97 | L | 0% | 0.0 |
| 2-10 | Seattle (165.0) | WAC | H | 81-91 | L | 0% | 0.0 |
| 2-15 | UMKC (256.0) | WAC | A | 76-67 | L | 0% | 0.0 |
| 2-22 | New Mexico St. (35.0) | WAC | A | 78-67 | L | 0% | 0.0 |
| 2-24 | UT Rio Grande Valley (229.0) | WAC | A | 83-75 | L | 0% | 0.0 |
| 3-3 | UMKC (256.0) | WAC | H | 96-82 | W | 100% | 0.0 |
| 3-8 | New Mexico St. (35.0) | WAC | N | 97-70 | L | 0% | 0.0 |
| Team | Conf | Curr Wgt | Fut Wgt | Curr W/L | Exp W/L | Curr Impact | Exp Impact |
|---|---|---|---|---|---|---|---|
| Chicago St. | WAC | 26.33 | 26.33 | 2.38 | 2.38 | -25.07 | -25.07 |
| New Mexico St. | WAC | 5.79 | 5.79 | 81.48 | 81.48 | 3.64 | 3.64 |
| Grand Canyon | WAC | 4.27 | 4.27 | 63.33 | 63.33 | 1.14 | 1.14 |
| Seattle | WAC | 4.21 | 4.21 | 53.57 | 53.57 | 0.30 | 0.30 |
| Utah Valley | WAC | 4.18 | 4.18 | 62.96 | 62.96 | 1.08 | 1.08 |
| UT Rio Grande Valley | WAC | 4.12 | 4.12 | 39.29 | 39.29 | -0.88 | -0.88 |
| UMKC | WAC | 4.12 | 4.12 | 25.93 | 25.93 | -1.98 | -1.98 |
| Cal St. Bakersfield | WAC | 4.11 | 4.11 | 28.00 | 28.00 | -1.81 | -1.81 |
| Drake | MVC | 1.83 | 1.83 | 46.67 | 46.67 | -0.12 | -0.12 |
| Purdue | B10 | 1.82 | 1.82 | 81.82 | 81.82 | 1.16 | 1.16 |
| Wisconsin | B10 | 1.82 | 1.82 | 43.75 | 43.75 | -0.23 | -0.23 |
| Bradley | MVC | 1.80 | 1.80 | 58.06 | 58.06 | 0.29 | 0.29 |
| Iowa | B10 | 1.80 | 1.80 | 40.62 | 40.62 | -0.34 | -0.34 |
| Northern Illinois | MAC | 1.77 | 1.77 | 34.48 | 34.48 | -0.55 | -0.55 |
| Northern Iowa | MVC | 1.77 | 1.77 | 44.83 | 44.83 | -0.18 | -0.18 |
| Northwestern | B10 | 1.77 | 1.77 | 43.33 | 43.33 | -0.24 | -0.24 |
| Western Michigan | MAC | 1.75 | 1.75 | 48.28 | 48.28 | -0.06 | -0.06 |
| Marquette | BE | 1.74 | 1.74 | 58.06 | 58.06 | 0.28 | 0.28 |
| Oakland | Horz | 1.69 | 1.69 | 56.25 | 56.25 | 0.21 | 0.21 |
| SIU Edwardsville | OVC | 1.69 | 1.69 | 27.59 | 27.59 | -0.76 | -0.76 |
| Notre Dame | ACC | 1.67 | 1.67 | 56.25 | 56.25 | 0.21 | 0.21 |
| Presbyterian | BSth | 1.67 | 1.67 | 25.00 | 25.00 | -0.83 | -0.83 |
| UMBC | AE | 1.67 | 1.67 | 66.67 | 66.67 | 0.56 | 0.56 |
| Illinois | B10 | 0.29 | 0.29 | 41.94 | 41.94 | -0.05 | -0.05 |
| Loyola Chicago | MVC | 0.27 | 0.27 | 84.38 | 84.38 | 0.19 | 0.19 |
| Central Michigan | MAC | 0.26 | 0.26 | 53.33 | 53.33 | 0.02 | 0.02 |
| Valparaiso | MVC | 0.24 | 0.24 | 43.33 | 43.33 | -0.03 | -0.03 |
| Michigan | B10 | 0.23 | 0.23 | 79.41 | 79.41 | 0.13 | 0.13 |
| Georgia Southern | SB | 0.21 | 0.21 | 61.29 | 61.29 | 0.05 | 0.05 |
| Maryland | B10 | 0.21 | 0.21 | 58.06 | 58.06 | 0.03 | 0.03 |
| Minnesota | B10 | 0.21 | 0.21 | 46.88 | 46.88 | -0.01 | -0.01 |
| Penn St. | B10 | 0.21 | 0.21 | 61.76 | 61.76 | 0.05 | 0.05 |
| Michigan St. | B10 | 0.20 | 0.20 | 87.88 | 87.88 | 0.15 | 0.15 |
| Evansville | MVC | 0.19 | 0.19 | 50.00 | 50.00 | 0.00 | 0.00 |
| Southern Illinois | MVC | 0.19 | 0.19 | 59.38 | 59.38 | 0.04 | 0.04 |
| Grambling St. | SWAC | 0.19 | 0.19 | 53.33 | 53.33 | 0.01 | 0.01 |
| Nicholls St. | Slnd | 0.17 | 0.17 | 60.71 | 60.71 | 0.04 | 0.04 |
| New Mexico | MWC | 0.17 | 0.17 | 54.55 | 54.55 | 0.02 | 0.02 |
| UTEP | CUSA | 0.17 | 0.17 | 33.33 | 33.33 | -0.06 | -0.06 |
| UC Riverside | BW | 0.17 | 0.17 | 24.14 | 24.14 | -0.09 | -0.09 |
| North Carolina St. | ACC | 0.16 | 0.16 | 65.62 | 65.62 | 0.05 | 0.05 |
| Eastern Michigan | MAC | 0.16 | 0.16 | 58.62 | 58.62 | 0.03 | 0.03 |
| Illinois St. | MVC | 0.16 | 0.16 | 53.12 | 53.12 | 0.01 | 0.01 |
| Indiana St. | MVC | 0.16 | 0.16 | 37.93 | 37.93 | -0.04 | -0.04 |
| Missouri St. | MVC | 0.16 | 0.16 | 53.12 | 53.12 | 0.01 | 0.01 |
| IUPUI | Horz | 0.15 | 0.15 | 32.14 | 32.14 | -0.06 | -0.06 |
| Indiana | B10 | 0.15 | 0.15 | 51.61 | 51.61 | 0.00 | 0.00 |
| Idaho | BSky | 0.15 | 0.15 | 68.97 | 68.97 | 0.06 | 0.06 |
| Rutgers | B10 | 0.15 | 0.15 | 42.42 | 42.42 | -0.02 | -0.02 |
| Southeast Missouri St. | OVC | 0.14 | 0.14 | 41.38 | 41.38 | -0.02 | -0.02 |
| Saint Mary's | WCC | 0.14 | 0.14 | 84.85 | 84.85 | 0.10 | 0.10 |
| UC Irvine | BW | 0.14 | 0.14 | 48.48 | 48.48 | -0.00 | -0.00 |
| Ball St. | MAC | 0.14 | 0.14 | 58.06 | 58.06 | 0.02 | 0.02 |
| Toledo | MAC | 0.14 | 0.14 | 66.67 | 66.67 | 0.05 | 0.05 |
| San Diego | WCC | 0.14 | 0.14 | 56.67 | 56.67 | 0.02 | 0.02 |
| Detroit | Horz | 0.13 | 0.13 | 20.00 | 20.00 | -0.08 | -0.08 |
| Georgia Tech | ACC | 0.13 | 0.13 | 40.62 | 40.62 | -0.02 | -0.02 |
| Vermont | AE | 0.13 | 0.13 | 78.79 | 78.79 | 0.08 | 0.08 |
| Milwaukee | Horz | 0.13 | 0.13 | 48.39 | 48.39 | -0.00 | -0.00 |
| DePaul | BE | 0.13 | 0.13 | 35.48 | 35.48 | -0.04 | -0.04 |
| Nebraska | B10 | 0.13 | 0.13 | 68.75 | 68.75 | 0.05 | 0.05 |
| Ohio St. | B10 | 0.13 | 0.13 | 75.00 | 75.00 | 0.06 | 0.06 |
| Cal St. Fullerton | BW | 0.11 | 0.11 | 62.07 | 62.07 | 0.03 | 0.03 |
| Arizona | P12 | 0.11 | 0.11 | 79.41 | 79.41 | 0.07 | 0.07 |
| Idaho St. | BSky | 0.11 | 0.11 | 42.86 | 42.86 | -0.02 | -0.02 |
| Tennessee Martin | OVC | 0.11 | 0.11 | 27.59 | 27.59 | -0.05 | -0.05 |
| Delaware | CAA | 0.11 | 0.11 | 38.71 | 38.71 | -0.03 | -0.03 |
| Belmont | OVC | 0.11 | 0.11 | 72.73 | 72.73 | 0.05 | 0.05 |
| Buffalo | MAC | 0.11 | 0.11 | 75.76 | 75.76 | 0.06 | 0.06 |
| Texas A&M Corpus Chris | Slnd | 0.11 | 0.11 | 30.77 | 30.77 | -0.04 | -0.04 |
| SMU | Amer | 0.11 | 0.11 | 51.52 | 51.52 | 0.00 | 0.00 |
| South Dakota St. | Sum | 0.11 | 0.11 | 80.00 | 80.00 | 0.07 | 0.07 |
| Longwood | BSth | 0.11 | 0.11 | 13.33 | 13.33 | -0.08 | -0.08 |
| Wichita St. | Amer | 0.11 | 0.11 | 78.12 | 78.12 | 0.06 | 0.06 |
| Miami FL | ACC | 0.11 | 0.11 | 70.97 | 70.97 | 0.05 | 0.05 |
| Duke | ACC | 0.11 | 0.11 | 78.79 | 78.79 | 0.06 | 0.06 |
| Eastern Illinois | OVC | 0.11 | 0.11 | 34.48 | 34.48 | -0.03 | -0.03 |
| Creighton | BE | 0.11 | 0.11 | 64.52 | 64.52 | 0.03 | 0.03 |
| Villanova | BE | 0.11 | 0.11 | 88.24 | 88.24 | 0.08 | 0.08 |
| UMass Lowell | AE | 0.11 | 0.11 | 37.93 | 37.93 | -0.03 | -0.03 |
| Xavier | BE | 0.11 | 0.11 | 84.85 | 84.85 | 0.07 | 0.07 |
| Virginia Tech | ACC | 0.10 | 0.10 | 65.62 | 65.62 | 0.03 | 0.03 |
| St. John's | BE | 0.10 | 0.10 | 46.88 | 46.88 | -0.01 | -0.01 |
| Green Bay | Horz | 0.10 | 0.10 | 33.33 | 33.33 | -0.03 | -0.03 |
| Cleveland St. | Horz | 0.10 | 0.10 | 32.35 | 32.35 | -0.04 | -0.04 |
| Louisville | ACC | 0.10 | 0.10 | 60.61 | 60.61 | 0.02 | 0.02 |
| UCLA | P12 | 0.09 | 0.09 | 65.62 | 65.62 | 0.03 | 0.03 |
| Charleston Southern | BSth | 0.09 | 0.09 | 42.86 | 42.86 | -0.01 | -0.01 |
| Manhattan | MAAC | 0.09 | 0.09 | 45.16 | 45.16 | -0.01 | -0.01 |
| Penn | Ivy | 0.09 | 0.09 | 74.19 | 74.19 | 0.04 | 0.04 |
| South Dakota | Sum | 0.08 | 0.08 | 73.33 | 73.33 | 0.04 | 0.04 |
| UTSA | CUSA | 0.08 | 0.08 | 53.33 | 53.33 | 0.01 | 0.01 |
| Weber St. | BSky | 0.08 | 0.08 | 60.71 | 60.71 | 0.02 | 0.02 |
| Colorado St. | MWC | 0.08 | 0.08 | 32.26 | 32.26 | -0.03 | -0.03 |
| Davidson | A10 | 0.08 | 0.08 | 65.62 | 65.62 | 0.03 | 0.03 |
| Prairie View A&M | SWAC | 0.08 | 0.08 | 45.45 | 45.45 | -0.01 | -0.01 |
| USC | P12 | 0.08 | 0.08 | 67.65 | 67.65 | 0.03 | 0.03 |
| Akron | MAC | 0.08 | 0.08 | 41.94 | 41.94 | -0.01 | -0.01 |
| Bowling Green | MAC | 0.08 | 0.08 | 46.67 | 46.67 | -0.01 | -0.01 |
| Kent St. | MAC | 0.08 | 0.08 | 48.48 | 48.48 | -0.00 | -0.00 |
| Miami OH | MAC | 0.08 | 0.08 | 45.16 | 45.16 | -0.01 | -0.01 |
| Saint Louis | A10 | 0.08 | 0.08 | 50.00 | 50.00 | 0.00 | 0.00 |
| UT Arlington | SB | 0.08 | 0.08 | 60.61 | 60.61 | 0.02 | 0.02 |
| Iowa St. | B12 | 0.08 | 0.08 | 41.94 | 41.94 | -0.01 | -0.01 |
| Hartford | AE | 0.08 | 0.08 | 58.06 | 58.06 | 0.01 | 0.01 |
| Tennessee St. | OVC | 0.08 | 0.08 | 46.43 | 46.43 | -0.01 | -0.01 |
| Illinois Chicago | Horz | 0.08 | 0.08 | 50.00 | 50.00 | 0.00 | 0.00 |
| North Carolina | ACC | 0.08 | 0.08 | 71.43 | 71.43 | 0.03 | 0.03 |
| Little Rock | SB | 0.08 | 0.08 | 20.00 | 20.00 | -0.05 | -0.05 |
| Northern Kentucky | Horz | 0.08 | 0.08 | 68.97 | 68.97 | 0.03 | 0.03 |
| Butler | BE | 0.08 | 0.08 | 60.61 | 60.61 | 0.02 | 0.02 |
| Arkansas | SEC | 0.06 | 0.06 | 67.65 | 67.65 | 0.02 | 0.02 |
| Fresno St. | MWC | 0.06 | 0.06 | 63.33 | 63.33 | 0.02 | 0.02 |
| Lamar | Slnd | 0.06 | 0.06 | 53.57 | 53.57 | 0.00 | 0.00 |
| Northern Arizona | BSky | 0.06 | 0.06 | 13.33 | 13.33 | -0.05 | -0.05 |
| BYU | WCC | 0.06 | 0.06 | 70.59 | 70.59 | 0.02 | 0.02 |
| Campbell | BSth | 0.06 | 0.06 | 46.43 | 46.43 | -0.00 | -0.00 |
| Gardner Webb | BSth | 0.06 | 0.06 | 37.93 | 37.93 | -0.01 | -0.01 |
| Hawaii | BW | 0.06 | 0.06 | 53.57 | 53.57 | 0.00 | 0.00 |
| High Point | BSth | 0.06 | 0.06 | 40.74 | 40.74 | -0.01 | -0.01 |
| Incarnate Word | Slnd | 0.06 | 0.06 | 12.50 | 12.50 | -0.04 | -0.04 |
| Kansas St. | B12 | 0.06 | 0.06 | 66.67 | 66.67 | 0.02 | 0.02 |
| Kentucky | SEC | 0.06 | 0.06 | 70.59 | 70.59 | 0.02 | 0.02 |
| Liberty | BSth | 0.06 | 0.06 | 54.84 | 54.84 | 0.01 | 0.01 |
| North Dakota | BSky | 0.06 | 0.06 | 33.33 | 33.33 | -0.02 | -0.02 |
| Radford | BSth | 0.06 | 0.06 | 62.50 | 62.50 | 0.01 | 0.01 |
| Sam Houston St. | Slnd | 0.06 | 0.06 | 51.72 | 51.72 | 0.00 | 0.00 |
| UC Davis | BW | 0.06 | 0.06 | 66.67 | 66.67 | 0.02 | 0.02 |
| UNC Asheville | BSth | 0.06 | 0.06 | 61.29 | 61.29 | 0.01 | 0.01 |
| USC Upstate | ASun | 0.06 | 0.06 | 10.71 | 10.71 | -0.05 | -0.05 |
| Winthrop | BSth | 0.06 | 0.06 | 57.14 | 57.14 | 0.01 | 0.01 |
| Austin Peay | OVC | 0.06 | 0.06 | 53.33 | 53.33 | 0.00 | 0.00 |
| Bethune Cookman | MEAC | 0.06 | 0.06 | 53.33 | 53.33 | 0.00 | 0.00 |
| California | P12 | 0.06 | 0.06 | 25.81 | 25.81 | -0.03 | -0.03 |
| Eastern Washington | BSky | 0.06 | 0.06 | 56.25 | 56.25 | 0.01 | 0.01 |
| Hampton | MEAC | 0.06 | 0.06 | 51.61 | 51.61 | 0.00 | 0.00 |
| Kennesaw St. | ASun | 0.06 | 0.06 | 28.57 | 28.57 | -0.02 | -0.02 |
| Murray St. | OVC | 0.06 | 0.06 | 82.76 | 82.76 | 0.04 | 0.04 |
| North Texas | CUSA | 0.06 | 0.06 | 43.33 | 43.33 | -0.01 | -0.01 |
| Ohio | MAC | 0.06 | 0.06 | 43.33 | 43.33 | -0.01 | -0.01 |
| Oklahoma St. | B12 | 0.06 | 0.06 | 57.58 | 57.58 | 0.01 | 0.01 |
| Portland | WCC | 0.06 | 0.06 | 24.14 | 24.14 | -0.03 | -0.03 |
| Rice | CUSA | 0.06 | 0.06 | 17.24 | 17.24 | -0.04 | -0.04 |
| South Carolina | SEC | 0.06 | 0.06 | 50.00 | 50.00 | 0.00 | 0.00 |
| Tennessee Tech | OVC | 0.06 | 0.06 | 54.84 | 54.84 | 0.01 | 0.01 |
| Texas A&M | SEC | 0.06 | 0.06 | 62.50 | 62.50 | 0.01 | 0.01 |
| Texas St. | SB | 0.06 | 0.06 | 41.94 | 41.94 | -0.01 | -0.01 |
| Washington | P12 | 0.06 | 0.06 | 62.50 | 62.50 | 0.01 | 0.01 |
| Washington St. | P12 | 0.06 | 0.06 | 38.71 | 38.71 | -0.01 | -0.01 |
| South Carolina St. | MEAC | 0.05 | 0.05 | 26.67 | 26.67 | -0.03 | -0.03 |
| Albany | AE | 0.05 | 0.05 | 67.74 | 67.74 | 0.02 | 0.02 |
| Binghamton | AE | 0.05 | 0.05 | 31.03 | 31.03 | -0.02 | -0.02 |
| Maine | AE | 0.05 | 0.05 | 13.33 | 13.33 | -0.04 | -0.04 |
| Nebraska Omaha | Sum | 0.05 | 0.05 | 24.14 | 24.14 | -0.03 | -0.03 |
| New Hampshire | AE | 0.05 | 0.05 | 27.59 | 27.59 | -0.02 | -0.02 |
| Stony Brook | AE | 0.05 | 0.05 | 38.71 | 38.71 | -0.01 | -0.01 |
| Tennessee | SEC | 0.05 | 0.05 | 75.76 | 75.76 | 0.03 | 0.03 |
| Fort Wayne | Sum | 0.05 | 0.05 | 50.00 | 50.00 | 0.00 | 0.00 |
| Colorado | P12 | 0.05 | 0.05 | 53.12 | 53.12 | 0.00 | 0.00 |
| Towson | CAA | 0.05 | 0.05 | 53.33 | 53.33 | 0.00 | 0.00 |
| Wake Forest | ACC | 0.05 | 0.05 | 35.48 | 35.48 | -0.02 | -0.02 |
| Boise St. | MWC | 0.05 | 0.05 | 73.33 | 73.33 | 0.02 | 0.02 |
| Florida A&M | MEAC | 0.05 | 0.05 | 24.24 | 24.24 | -0.03 | -0.03 |
| Georgetown | BE | 0.05 | 0.05 | 50.00 | 50.00 | 0.00 | 0.00 |
| Mississippi Valley St. | SWAC | 0.05 | 0.05 | 12.50 | 12.50 | -0.04 | -0.04 |
| Morgan St. | MEAC | 0.05 | 0.05 | 36.67 | 36.67 | -0.01 | -0.01 |
| Norfolk St. | MEAC | 0.05 | 0.05 | 43.33 | 43.33 | -0.01 | -0.01 |
| North Carolina Central | MEAC | 0.05 | 0.05 | 51.61 | 51.61 | 0.00 | 0.00 |
| Providence | BE | 0.05 | 0.05 | 61.76 | 61.76 | 0.01 | 0.01 |
| Robert Morris | NEC | 0.05 | 0.05 | 48.48 | 48.48 | -0.00 | -0.00 |
| Seton Hall | BE | 0.05 | 0.05 | 65.62 | 65.62 | 0.02 | 0.02 |
| LSU | SEC | 0.05 | 0.05 | 54.84 | 54.84 | 0.00 | 0.00 |
| Mount St. Mary's | NEC | 0.05 | 0.05 | 53.33 | 53.33 | 0.00 | 0.00 |
| Boston College | ACC | 0.05 | 0.05 | 55.88 | 55.88 | 0.01 | 0.01 |
| Pittsburgh | ACC | 0.05 | 0.05 | 25.00 | 25.00 | -0.03 | -0.03 |
| Syracuse | ACC | 0.05 | 0.05 | 60.61 | 60.61 | 0.01 | 0.01 |
| Virginia | ACC | 0.05 | 0.05 | 93.94 | 93.94 | 0.04 | 0.04 |
| Wright St. | Horz | 0.05 | 0.05 | 71.88 | 71.88 | 0.02 | 0.02 |
| Youngstown St. | Horz | 0.05 | 0.05 | 20.00 | 20.00 | -0.03 | -0.03 |
| Western Kentucky | CUSA | 0.05 | 0.05 | 69.70 | 69.70 | 0.02 | 0.02 |
| Charlotte | CUSA | 0.03 | 0.03 | 17.86 | 17.86 | -0.02 | -0.02 |
| North Carolina A&T | MEAC | 0.03 | 0.03 | 56.25 | 56.25 | 0.00 | 0.00 |
| UNC Greensboro | SC | 0.03 | 0.03 | 77.42 | 77.42 | 0.02 | 0.02 |
| VMI | SC | 0.03 | 0.03 | 25.00 | 25.00 | -0.01 | -0.01 |
| Alcorn St. | SWAC | 0.03 | 0.03 | 25.00 | 25.00 | -0.01 | -0.01 |
| Appalachian St. | SB | 0.03 | 0.03 | 41.94 | 41.94 | -0.00 | -0.00 |
| Central Connecticut | NEC | 0.03 | 0.03 | 43.75 | 43.75 | -0.00 | -0.00 |
| Eastern Kentucky | OVC | 0.03 | 0.03 | 31.03 | 31.03 | -0.01 | -0.01 |
| Florida Atlantic | CUSA | 0.03 | 0.03 | 32.14 | 32.14 | -0.01 | -0.01 |
| Jacksonville St. | OVC | 0.03 | 0.03 | 62.50 | 62.50 | 0.01 | 0.01 |
| Morehead St. | OVC | 0.03 | 0.03 | 22.22 | 22.22 | -0.02 | -0.02 |
| South Alabama | SB | 0.03 | 0.03 | 40.00 | 40.00 | -0.01 | -0.01 |
| Stetson | ASun | 0.03 | 0.03 | 28.57 | 28.57 | -0.01 | -0.01 |
| Tulsa | Amer | 0.03 | 0.03 | 61.29 | 61.29 | 0.01 | 0.01 |
| UNLV | MWC | 0.03 | 0.03 | 60.61 | 60.61 | 0.01 | 0.01 |
| Western Illinois | Sum | 0.03 | 0.03 | 33.33 | 33.33 | -0.01 | -0.01 |
| Army | Pat | 0.03 | 0.03 | 41.38 | 41.38 | -0.00 | -0.00 |
| Brown | Ivy | 0.03 | 0.03 | 38.46 | 38.46 | -0.01 | -0.01 |
| Colgate | Pat | 0.03 | 0.03 | 58.06 | 58.06 | 0.00 | 0.00 |
| Coppin St. | MEAC | 0.03 | 0.03 | 15.62 | 15.62 | -0.02 | -0.02 |
| Delaware St. | MEAC | 0.03 | 0.03 | 6.67 | 6.67 | -0.02 | -0.02 |
| Drexel | CAA | 0.03 | 0.03 | 37.50 | 37.50 | -0.01 | -0.01 |
| La Salle | A10 | 0.03 | 0.03 | 40.62 | 40.62 | -0.01 | -0.01 |
| Loyola MD | Pat | 0.03 | 0.03 | 26.67 | 26.67 | -0.01 | -0.01 |
| Maryland Eastern Shore | MEAC | 0.03 | 0.03 | 16.67 | 16.67 | -0.02 | -0.02 |
| Oklahoma | B12 | 0.03 | 0.03 | 58.06 | 58.06 | 0.00 | 0.00 |
| Sacred Heart | NEC | 0.03 | 0.03 | 30.00 | 30.00 | -0.01 | -0.01 |
| Saint Peter's | MAAC | 0.03 | 0.03 | 43.75 | 43.75 | -0.00 | -0.00 |
| Texas Tech | B12 | 0.03 | 0.03 | 72.73 | 72.73 | 0.01 | 0.01 |
| The Citadel | SC | 0.03 | 0.03 | 27.59 | 27.59 | -0.01 | -0.01 |
| Wyoming | MWC | 0.03 | 0.03 | 59.38 | 59.38 | 0.01 | 0.01 |
| American | Pat | 0.03 | 0.03 | 20.00 | 20.00 | -0.02 | -0.02 |
| Georgia | SEC | 0.03 | 0.03 | 54.55 | 54.55 | 0.00 | 0.00 |
| Mississippi | SEC | 0.03 | 0.03 | 37.50 | 37.50 | -0.01 | -0.01 |
| San Diego St. | MWC | 0.03 | 0.03 | 67.74 | 67.74 | 0.01 | 0.01 |
| VCU | A10 | 0.03 | 0.03 | 54.55 | 54.55 | 0.00 | 0.00 |
| Alabama St. | SWAC | 0.03 | 0.03 | 25.81 | 25.81 | -0.01 | -0.01 |
| Baylor | B12 | 0.03 | 0.03 | 54.84 | 54.84 | 0.00 | 0.00 |
| Clemson | ACC | 0.03 | 0.03 | 71.88 | 71.88 | 0.01 | 0.01 |
| Dartmouth | Ivy | 0.03 | 0.03 | 23.08 | 23.08 | -0.01 | -0.01 |
| Florida St. | ACC | 0.03 | 0.03 | 64.52 | 64.52 | 0.01 | 0.01 |
| Kansas | B12 | 0.03 | 0.03 | 79.41 | 79.41 | 0.01 | 0.01 |
| Louisiana Lafayette | SB | 0.03 | 0.03 | 80.65 | 80.65 | 0.02 | 0.02 |
| New Orleans | Slnd | 0.03 | 0.03 | 42.86 | 42.86 | -0.00 | -0.00 |
| Oral Roberts | Sum | 0.03 | 0.03 | 28.57 | 28.57 | -0.01 | -0.01 |
| Southeastern Louisiana | Slnd | 0.03 | 0.03 | 63.33 | 63.33 | 0.01 | 0.01 |
| Southern | SWAC | 0.03 | 0.03 | 41.94 | 41.94 | -0.00 | -0.00 |
| Southern Utah | BSky | 0.03 | 0.03 | 36.67 | 36.67 | -0.01 | -0.01 |
| St. Francis NY | NEC | 0.03 | 0.03 | 37.93 | 37.93 | -0.01 | -0.01 |
| Temple | Amer | 0.03 | 0.03 | 53.12 | 53.12 | 0.00 | 0.00 |
| Texas Southern | SWAC | 0.03 | 0.03 | 44.12 | 44.12 | -0.00 | -0.00 |
| UAB | CUSA | 0.03 | 0.03 | 58.06 | 58.06 | 0.00 | 0.00 |
| Yale | Ivy | 0.03 | 0.03 | 50.00 | 50.00 | 0.00 | 0.00 |
| Fairfield | MAAC | 0.02 | 0.02 | 51.52 | 51.52 | 0.00 | 0.00 |
| Lipscomb | ASun | 0.02 | 0.02 | 68.97 | 68.97 | 0.01 | 0.01 |