
 - Blog
| Conference: | Horz |
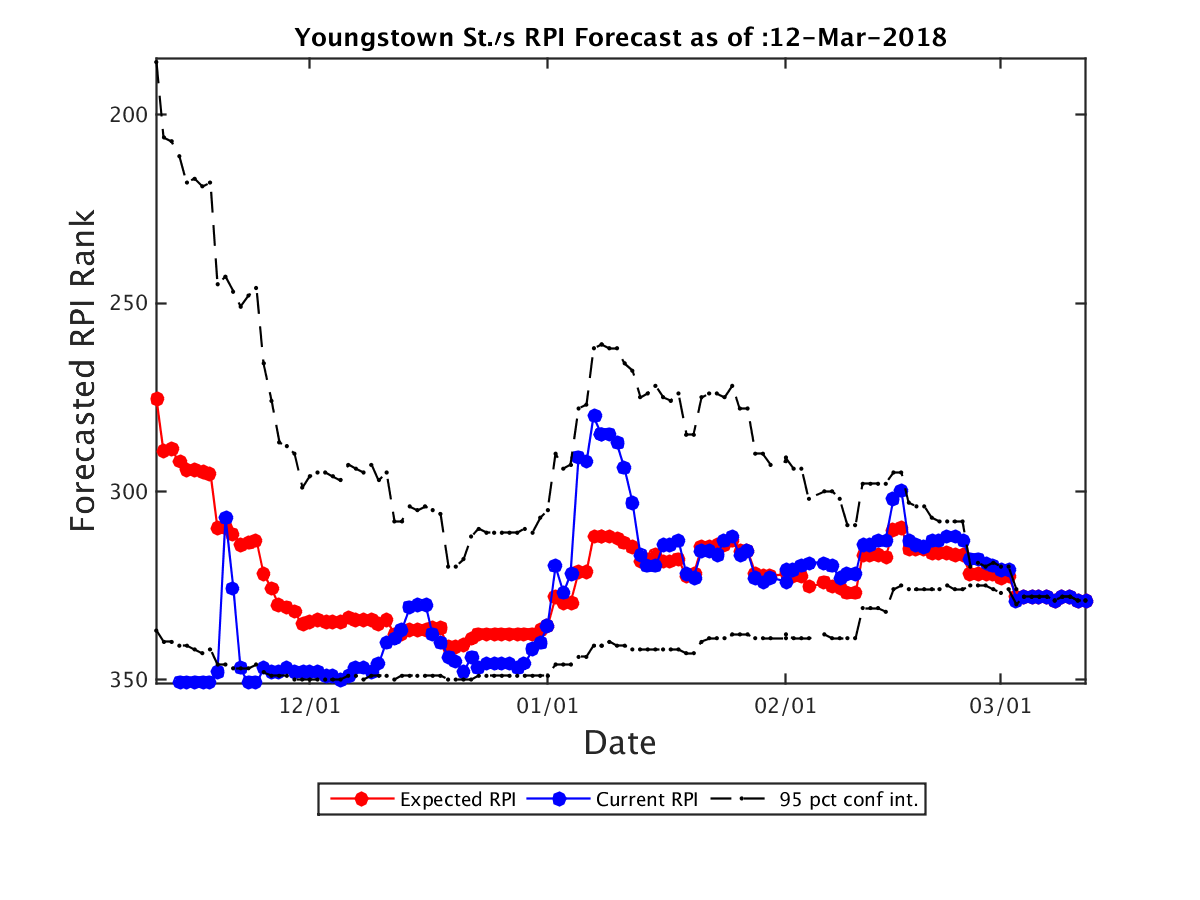
| Expected RPI: | 329.0 |
| Current RPI: | 329 |
| Expected SOS: | 250 |
| Current SOS: | 250 |
| Current Record: | 6-24 |
| Expected Record: | 6-24 |
| Current Conf Record: | 6-13 |
| Expected Conf Record: | 6-13 |
| Expected Record vs RPI 1-25: | 0-0 |
| Expected Record vs RPI 26-50: | 0-1 |
| Expected Record vs RPI 51-100: | 0-3 |
| Expected Record vs RPI 101-200: | 1-10 |
| Expected Record vs RPI 200+: | 5-10 |
| Current OOC Record: | 0-11 |
| Expected OOC Record: | 0-11 |
| Expected OOC RPI: | 337 |
| Expected OOC SOS: | 147 |
| Final Record | Expected RPI | Probability |
|---|---|---|
| 6-24 | 329.0 | 100.00% |
| Date | Opponent (Expected RPI) | Conf | Location | Score | Outcome | Prob(W) | Spread |
|---|---|---|---|---|---|---|---|
| 11-11 | Kent St. (154.0) | MAC | N | 78-111 | L | 0% | 0.0 |
| 11-18 | Canisius (124.0) | MAAC | A | 104-84 | L | 0% | 0.0 |
| 11-24 | Northern Colorado (110.0) | BSky | N | 67-80 | L | 0% | 0.0 |
| 11-25 | Southern Miss (207.0) | CUSA | N | 71-64 | L | 0% | 0.0 |
| 11-26 | South Dakota (91.0) | Sum | N | 81-53 | L | 0% | 0.0 |
| 11-29 | Robert Morris (196.0) | NEC | H | 74-81 | L | 0% | 0.0 |
| 12-2 | DePaul (186.0) | BE | A | 89-73 | L | 0% | 0.0 |
| 12-9 | Butler (41.0) | BE | A | 95-67 | L | 0% | 0.0 |
| 12-18 | Idaho St. (268.0) | BSky | A | 86-62 | L | 0% | 0.0 |
| 12-20 | Utah St. (152.0) | MWC | A | 91-74 | L | 0% | 0.0 |
| 12-29 | Indiana (125.0) | B10 | A | 79-51 | L | 0% | 0.0 |
| 1-1 | Cleveland St. (282.0) | Horz | A | 77-80 | W | 100% | 0.0 |
| 1-4 | Milwaukee (231.0) | Horz | H | 72-63 | W | 100% | 0.0 |
| 1-6 | Green Bay (303.0) | Horz | H | 85-74 | W | 100% | 0.0 |
| 1-10 | Oakland (182.0) | Horz | A | 95-82 | L | 0% | 0.0 |
| 1-12 | Detroit (318.0) | Horz | A | 93-91 | L | 0% | 0.0 |
| 1-15 | Wright St. (99.0) | Horz | A | 77-67 | L | 0% | 0.0 |
| 1-18 | Illinois Chicago (236.0) | Horz | H | 78-92 | L | 0% | 0.0 |
| 1-20 | IUPUI (294.0) | Horz | H | 85-62 | W | 100% | 0.0 |
| 1-25 | Milwaukee (231.0) | Horz | A | 66-55 | L | 0% | 0.0 |
| 1-27 | Green Bay (303.0) | Horz | A | 85-67 | L | 0% | 0.0 |
| 2-1 | Northern Kentucky (115.0) | Horz | H | 85-95 | L | 0% | 0.0 |
| 2-3 | Wright St. (99.0) | Horz | H | 57-83 | L | 0% | 0.0 |
| 2-8 | Illinois Chicago (236.0) | Horz | A | 100-75 | L | 0% | 0.0 |
| 2-10 | IUPUI (294.0) | Horz | A | 80-84 | W | 100% | 0.0 |
| 2-14 | Oakland (182.0) | Horz | H | 75-73 | W | 100% | 0.0 |
| 2-16 | Detroit (318.0) | Horz | H | 84-94 | L | 0% | 0.0 |
| 2-19 | Northern Kentucky (115.0) | Horz | A | 70-51 | L | 0% | 0.0 |
| 2-24 | Cleveland St. (282.0) | Horz | H | 94-99 | L | 0% | 0.0 |
| 3-2 | Cleveland St. (282.0) | Horz | N | 72-71 | L | 0% | 0.0 |
| Team | Conf | Curr Wgt | Fut Wgt | Curr W/L | Exp W/L | Curr Impact | Exp Impact |
|---|---|---|---|---|---|---|---|
| Youngstown St. | Horz | 26.39 | 26.39 | 19.70 | 19.70 | -16.00 | -16.00 |
| Cleveland St. | Horz | 6.07 | 6.07 | 29.03 | 29.03 | -2.54 | -2.54 |
| Wright St. | Horz | 4.46 | 4.46 | 70.00 | 70.00 | 1.79 | 1.79 |
| Oakland | Horz | 4.39 | 4.39 | 58.06 | 58.06 | 0.71 | 0.71 |
| Milwaukee | Horz | 4.36 | 4.36 | 48.28 | 48.28 | -0.15 | -0.15 |
| Green Bay | Horz | 4.36 | 4.36 | 32.14 | 32.14 | -1.56 | -1.56 |
| Illinois Chicago | Horz | 4.33 | 4.33 | 46.43 | 46.43 | -0.31 | -0.31 |
| Northern Kentucky | Horz | 4.32 | 4.32 | 66.67 | 66.67 | 1.44 | 1.44 |
| Detroit | Horz | 4.30 | 4.30 | 14.29 | 14.29 | -3.07 | -3.07 |
| IUPUI | Horz | 4.29 | 4.29 | 34.62 | 34.62 | -1.32 | -1.32 |
| Kent St. | MAC | 1.79 | 1.79 | 46.88 | 46.88 | -0.11 | -0.11 |
| Northern Colorado | BSky | 1.78 | 1.78 | 60.00 | 60.00 | 0.36 | 0.36 |
| DePaul | BE | 1.77 | 1.77 | 33.33 | 33.33 | -0.59 | -0.59 |
| South Dakota | Sum | 1.72 | 1.72 | 72.41 | 72.41 | 0.77 | 0.77 |
| Southern Miss | CUSA | 1.72 | 1.72 | 37.93 | 37.93 | -0.42 | -0.42 |
| Butler | BE | 1.72 | 1.72 | 59.38 | 59.38 | 0.32 | 0.32 |
| Idaho St. | BSky | 1.72 | 1.72 | 40.74 | 40.74 | -0.32 | -0.32 |
| Robert Morris | NEC | 1.69 | 1.69 | 46.88 | 46.88 | -0.11 | -0.11 |
| Canisius | MAAC | 1.69 | 1.69 | 64.52 | 64.52 | 0.49 | 0.49 |
| Indiana | B10 | 1.67 | 1.67 | 50.00 | 50.00 | 0.00 | 0.00 |
| Utah St. | MWC | 1.67 | 1.67 | 46.88 | 46.88 | -0.10 | -0.10 |
| Western Michigan | MAC | 0.26 | 0.26 | 50.00 | 50.00 | 0.00 | 0.00 |
| Toledo | MAC | 0.26 | 0.26 | 66.67 | 66.67 | 0.09 | 0.09 |
| Fort Wayne | Sum | 0.24 | 0.24 | 50.00 | 50.00 | 0.00 | 0.00 |
| Northern Illinois | MAC | 0.22 | 0.22 | 36.67 | 36.67 | -0.06 | -0.06 |
| Michigan St. | B10 | 0.20 | 0.20 | 87.88 | 87.88 | 0.16 | 0.16 |
| Western Illinois | Sum | 0.19 | 0.19 | 33.33 | 33.33 | -0.06 | -0.06 |
| Loyola Chicago | MVC | 0.19 | 0.19 | 84.38 | 84.38 | 0.13 | 0.13 |
| East Tennessee St. | SC | 0.17 | 0.17 | 71.88 | 71.88 | 0.07 | 0.07 |
| Weber St. | BSky | 0.17 | 0.17 | 60.71 | 60.71 | 0.04 | 0.04 |
| Montana St. | BSky | 0.16 | 0.16 | 36.67 | 36.67 | -0.04 | -0.04 |
| Seton Hall | BE | 0.16 | 0.16 | 65.62 | 65.62 | 0.05 | 0.05 |
| Eastern Michigan | MAC | 0.15 | 0.15 | 58.62 | 58.62 | 0.03 | 0.03 |
| Central Connecticut | NEC | 0.15 | 0.15 | 43.75 | 43.75 | -0.02 | -0.02 |
| Morehead St. | OVC | 0.14 | 0.14 | 22.22 | 22.22 | -0.08 | -0.08 |
| Northern Arizona | BSky | 0.14 | 0.14 | 13.33 | 13.33 | -0.10 | -0.10 |
| Portland St. | BSky | 0.14 | 0.14 | 56.67 | 56.67 | 0.02 | 0.02 |
| Wisconsin | B10 | 0.14 | 0.14 | 45.45 | 45.45 | -0.01 | -0.01 |
| Ball St. | MAC | 0.14 | 0.14 | 58.06 | 58.06 | 0.02 | 0.02 |
| Bowling Green | MAC | 0.13 | 0.13 | 46.67 | 46.67 | -0.01 | -0.01 |
| Marquette | BE | 0.13 | 0.13 | 59.38 | 59.38 | 0.02 | 0.02 |
| Villanova | BE | 0.13 | 0.13 | 88.24 | 88.24 | 0.10 | 0.10 |
| Xavier | BE | 0.13 | 0.13 | 84.85 | 84.85 | 0.09 | 0.09 |
| Miami OH | MAC | 0.13 | 0.13 | 45.16 | 45.16 | -0.01 | -0.01 |
| Rutgers | B10 | 0.13 | 0.13 | 42.42 | 42.42 | -0.02 | -0.02 |
| Buffalo | MAC | 0.13 | 0.13 | 75.76 | 75.76 | 0.07 | 0.07 |
| Niagara | MAAC | 0.13 | 0.13 | 59.38 | 59.38 | 0.02 | 0.02 |
| Akron | MAC | 0.12 | 0.12 | 41.94 | 41.94 | -0.02 | -0.02 |
| Southern Utah | BSky | 0.12 | 0.12 | 36.67 | 36.67 | -0.03 | -0.03 |
| Eastern Illinois | OVC | 0.12 | 0.12 | 34.48 | 34.48 | -0.04 | -0.04 |
| North Dakota | BSky | 0.11 | 0.11 | 33.33 | 33.33 | -0.04 | -0.04 |
| Purdue | B10 | 0.11 | 0.11 | 82.35 | 82.35 | 0.07 | 0.07 |
| Eastern Washington | BSky | 0.11 | 0.11 | 56.25 | 56.25 | 0.01 | 0.01 |
| Montana | BSky | 0.11 | 0.11 | 77.42 | 77.42 | 0.06 | 0.06 |
| Denver | Sum | 0.11 | 0.11 | 46.43 | 46.43 | -0.01 | -0.01 |
| Michigan | B10 | 0.11 | 0.11 | 79.41 | 79.41 | 0.06 | 0.06 |
| Iona | MAAC | 0.11 | 0.11 | 60.61 | 60.61 | 0.02 | 0.02 |
| Belmont | OVC | 0.11 | 0.11 | 72.73 | 72.73 | 0.05 | 0.05 |
| FIU | CUSA | 0.11 | 0.11 | 37.93 | 37.93 | -0.03 | -0.03 |
| San Jose St. | MWC | 0.11 | 0.11 | 10.34 | 10.34 | -0.09 | -0.09 |
| Murray St. | OVC | 0.11 | 0.11 | 82.76 | 82.76 | 0.07 | 0.07 |
| Oral Roberts | Sum | 0.11 | 0.11 | 28.57 | 28.57 | -0.05 | -0.05 |
| Jacksonville | ASun | 0.11 | 0.11 | 37.93 | 37.93 | -0.03 | -0.03 |
| Creighton | BE | 0.10 | 0.10 | 64.52 | 64.52 | 0.03 | 0.03 |
| Georgetown | BE | 0.10 | 0.10 | 50.00 | 50.00 | 0.00 | 0.00 |
| Ohio St. | B10 | 0.10 | 0.10 | 75.00 | 75.00 | 0.05 | 0.05 |
| Providence | BE | 0.10 | 0.10 | 61.76 | 61.76 | 0.02 | 0.02 |
| St. John's | BE | 0.10 | 0.10 | 46.88 | 46.88 | -0.01 | -0.01 |
| Arkansas St. | SB | 0.10 | 0.10 | 30.00 | 30.00 | -0.04 | -0.04 |
| Washington St. | P12 | 0.09 | 0.09 | 38.71 | 38.71 | -0.02 | -0.02 |
| Sacramento St. | BSky | 0.09 | 0.09 | 16.67 | 16.67 | -0.06 | -0.06 |
| Seattle | WAC | 0.09 | 0.09 | 56.67 | 56.67 | 0.01 | 0.01 |
| Gonzaga | WCC | 0.08 | 0.08 | 88.24 | 88.24 | 0.06 | 0.06 |
| Idaho | BSky | 0.08 | 0.08 | 68.97 | 68.97 | 0.03 | 0.03 |
| Middle Tennessee | CUSA | 0.08 | 0.08 | 76.67 | 76.67 | 0.04 | 0.04 |
| Nebraska Omaha | Sum | 0.08 | 0.08 | 24.14 | 24.14 | -0.04 | -0.04 |
| South Dakota St. | Sum | 0.08 | 0.08 | 80.00 | 80.00 | 0.05 | 0.05 |
| Mississippi St. | SEC | 0.08 | 0.08 | 65.62 | 65.62 | 0.03 | 0.03 |
| Troy | SB | 0.08 | 0.08 | 45.16 | 45.16 | -0.01 | -0.01 |
| UCLA | P12 | 0.08 | 0.08 | 65.62 | 65.62 | 0.03 | 0.03 |
| Delaware St. | MEAC | 0.08 | 0.08 | 6.67 | 6.67 | -0.07 | -0.07 |
| Indiana St. | MVC | 0.08 | 0.08 | 37.93 | 37.93 | -0.02 | -0.02 |
| Dartmouth | Ivy | 0.08 | 0.08 | 23.08 | 23.08 | -0.04 | -0.04 |
| Saint Louis | A10 | 0.08 | 0.08 | 50.00 | 50.00 | 0.00 | 0.00 |
| Illinois | B10 | 0.08 | 0.08 | 41.94 | 41.94 | -0.01 | -0.01 |
| Western Kentucky | CUSA | 0.08 | 0.08 | 69.70 | 69.70 | 0.03 | 0.03 |
| Elon | CAA | 0.08 | 0.08 | 40.00 | 40.00 | -0.02 | -0.02 |
| Fairfield | MAAC | 0.08 | 0.08 | 51.52 | 51.52 | 0.00 | 0.00 |
| Quinnipiac | MAAC | 0.08 | 0.08 | 36.36 | 36.36 | -0.02 | -0.02 |
| UNLV | MWC | 0.08 | 0.08 | 60.61 | 60.61 | 0.02 | 0.02 |
| Wyoming | MWC | 0.08 | 0.08 | 59.38 | 59.38 | 0.01 | 0.01 |
| Rider | MAAC | 0.08 | 0.08 | 70.97 | 70.97 | 0.03 | 0.03 |
| Siena | MAAC | 0.08 | 0.08 | 25.00 | 25.00 | -0.04 | -0.04 |
| Air Force | MWC | 0.08 | 0.08 | 34.48 | 34.48 | -0.02 | -0.02 |
| Boise St. | MWC | 0.08 | 0.08 | 73.33 | 73.33 | 0.04 | 0.04 |
| Mount St. Mary's | NEC | 0.08 | 0.08 | 53.33 | 53.33 | 0.01 | 0.01 |
| New Mexico | MWC | 0.08 | 0.08 | 54.55 | 54.55 | 0.01 | 0.01 |
| Wagner | NEC | 0.08 | 0.08 | 70.00 | 70.00 | 0.03 | 0.03 |
| Cincinnati | Amer | 0.07 | 0.07 | 88.24 | 88.24 | 0.06 | 0.06 |
| Coppin St. | MEAC | 0.07 | 0.07 | 15.62 | 15.62 | -0.05 | -0.05 |
| East Carolina | Amer | 0.07 | 0.07 | 33.33 | 33.33 | -0.02 | -0.02 |
| Bradley | MVC | 0.06 | 0.06 | 59.38 | 59.38 | 0.01 | 0.01 |
| Cal St. Northridge | BW | 0.06 | 0.06 | 14.29 | 14.29 | -0.04 | -0.04 |
| SIU Edwardsville | OVC | 0.06 | 0.06 | 30.00 | 30.00 | -0.02 | -0.02 |
| Eastern Kentucky | OVC | 0.06 | 0.06 | 31.03 | 31.03 | -0.02 | -0.02 |
| James Madison | CAA | 0.06 | 0.06 | 29.03 | 29.03 | -0.02 | -0.02 |
| Memphis | Amer | 0.06 | 0.06 | 61.76 | 61.76 | 0.01 | 0.01 |
| Texas A&M | SEC | 0.06 | 0.06 | 62.50 | 62.50 | 0.01 | 0.01 |
| UMBC | AE | 0.06 | 0.06 | 67.74 | 67.74 | 0.02 | 0.02 |
| Vermont | AE | 0.06 | 0.06 | 78.79 | 78.79 | 0.03 | 0.03 |
| Florida A&M | MEAC | 0.06 | 0.06 | 24.24 | 24.24 | -0.03 | -0.03 |
| Houston Baptist | Slnd | 0.06 | 0.06 | 10.71 | 10.71 | -0.04 | -0.04 |
| Illinois St. | MVC | 0.06 | 0.06 | 53.12 | 53.12 | 0.00 | 0.00 |
| Kentucky | SEC | 0.06 | 0.06 | 70.59 | 70.59 | 0.02 | 0.02 |
| Louisiana Tech | CUSA | 0.06 | 0.06 | 48.39 | 48.39 | -0.00 | -0.00 |
| Marshall | CUSA | 0.06 | 0.06 | 69.70 | 69.70 | 0.02 | 0.02 |
| Missouri | SEC | 0.06 | 0.06 | 61.29 | 61.29 | 0.01 | 0.01 |
| North Carolina Central | MEAC | 0.06 | 0.06 | 51.61 | 51.61 | 0.00 | 0.00 |
| North Dakota St. | Sum | 0.06 | 0.06 | 41.38 | 41.38 | -0.01 | -0.01 |
| Saint Joseph's | A10 | 0.06 | 0.06 | 50.00 | 50.00 | 0.00 | 0.00 |
| Stetson | ASun | 0.06 | 0.06 | 28.57 | 28.57 | -0.02 | -0.02 |
| UAB | CUSA | 0.06 | 0.06 | 58.06 | 58.06 | 0.01 | 0.01 |
| UTEP | CUSA | 0.06 | 0.06 | 33.33 | 33.33 | -0.02 | -0.02 |
| UTSA | CUSA | 0.06 | 0.06 | 53.33 | 53.33 | 0.00 | 0.00 |
| Virginia Tech | ACC | 0.06 | 0.06 | 65.62 | 65.62 | 0.02 | 0.02 |
| BYU | WCC | 0.06 | 0.06 | 70.59 | 70.59 | 0.02 | 0.02 |
| Alabama A&M | SWAC | 0.05 | 0.05 | 9.68 | 9.68 | -0.04 | -0.04 |
| Duke | ACC | 0.05 | 0.05 | 78.79 | 78.79 | 0.03 | 0.03 |
| Iowa | B10 | 0.05 | 0.05 | 42.42 | 42.42 | -0.01 | -0.01 |
| Iowa St. | B12 | 0.05 | 0.05 | 41.94 | 41.94 | -0.01 | -0.01 |
| Minnesota | B10 | 0.05 | 0.05 | 46.88 | 46.88 | -0.00 | -0.00 |
| Northwestern | B10 | 0.05 | 0.05 | 45.16 | 45.16 | -0.01 | -0.01 |
| Notre Dame | ACC | 0.05 | 0.05 | 57.58 | 57.58 | 0.01 | 0.01 |
| UC Davis | BW | 0.05 | 0.05 | 66.67 | 66.67 | 0.02 | 0.02 |
| Maryland | B10 | 0.05 | 0.05 | 58.06 | 58.06 | 0.01 | 0.01 |
| Gardner Webb | BSth | 0.05 | 0.05 | 37.93 | 37.93 | -0.01 | -0.01 |
| Georgia Tech | ACC | 0.05 | 0.05 | 40.62 | 40.62 | -0.01 | -0.01 |
| Marist | MAAC | 0.05 | 0.05 | 19.35 | 19.35 | -0.03 | -0.03 |
| Missouri St. | MVC | 0.05 | 0.05 | 53.12 | 53.12 | 0.00 | 0.00 |
| Monmouth | MAAC | 0.05 | 0.05 | 35.48 | 35.48 | -0.02 | -0.02 |
| Saint Peter's | MAAC | 0.05 | 0.05 | 43.75 | 43.75 | -0.01 | -0.01 |
| Albany | AE | 0.05 | 0.05 | 67.74 | 67.74 | 0.02 | 0.02 |
| Bryant | NEC | 0.05 | 0.05 | 9.68 | 9.68 | -0.04 | -0.04 |
| Central Michigan | MAC | 0.05 | 0.05 | 53.33 | 53.33 | 0.00 | 0.00 |
| Chicago St. | WAC | 0.05 | 0.05 | 3.33 | 3.33 | -0.05 | -0.05 |
| Colorado St. | MWC | 0.05 | 0.05 | 32.26 | 32.26 | -0.02 | -0.02 |
| Fairleigh Dickinson | NEC | 0.05 | 0.05 | 37.93 | 37.93 | -0.01 | -0.01 |
| Fresno St. | MWC | 0.05 | 0.05 | 63.33 | 63.33 | 0.01 | 0.01 |
| Kansas | B12 | 0.05 | 0.05 | 79.41 | 79.41 | 0.03 | 0.03 |
| LIU Brooklyn | NEC | 0.05 | 0.05 | 51.52 | 51.52 | 0.00 | 0.00 |
| Mississippi Valley St. | SWAC | 0.05 | 0.05 | 12.50 | 12.50 | -0.04 | -0.04 |
| Nevada | MWC | 0.05 | 0.05 | 79.41 | 79.41 | 0.03 | 0.03 |
| New Orleans | Slnd | 0.05 | 0.05 | 42.86 | 42.86 | -0.01 | -0.01 |
| Norfolk St. | MEAC | 0.05 | 0.05 | 43.33 | 43.33 | -0.01 | -0.01 |
| Northeastern | CAA | 0.05 | 0.05 | 68.75 | 68.75 | 0.02 | 0.02 |
| Ohio | MAC | 0.05 | 0.05 | 43.33 | 43.33 | -0.01 | -0.01 |
| Sacred Heart | NEC | 0.05 | 0.05 | 30.00 | 30.00 | -0.02 | -0.02 |
| St. Francis NY | NEC | 0.05 | 0.05 | 37.93 | 37.93 | -0.01 | -0.01 |
| St. Francis PA | NEC | 0.05 | 0.05 | 57.14 | 57.14 | 0.01 | 0.01 |
| Syracuse | ACC | 0.05 | 0.05 | 60.61 | 60.61 | 0.01 | 0.01 |
| Texas Southern | SWAC | 0.05 | 0.05 | 44.12 | 44.12 | -0.01 | -0.01 |
| Towson | CAA | 0.05 | 0.05 | 53.33 | 53.33 | 0.00 | 0.00 |
| Utah | P12 | 0.05 | 0.05 | 63.33 | 63.33 | 0.01 | 0.01 |
| Valparaiso | MVC | 0.05 | 0.05 | 43.33 | 43.33 | -0.01 | -0.01 |
| Arizona St. | P12 | 0.03 | 0.03 | 64.52 | 64.52 | 0.01 | 0.01 |
| Utah Valley | WAC | 0.03 | 0.03 | 65.52 | 65.52 | 0.01 | 0.01 |
| Charlotte | CUSA | 0.03 | 0.03 | 17.86 | 17.86 | -0.02 | -0.02 |
| Drake | MVC | 0.03 | 0.03 | 48.39 | 48.39 | -0.00 | -0.00 |
| Florida Atlantic | CUSA | 0.03 | 0.03 | 32.14 | 32.14 | -0.01 | -0.01 |
| Florida St. | ACC | 0.03 | 0.03 | 64.52 | 64.52 | 0.01 | 0.01 |
| Grambling St. | SWAC | 0.03 | 0.03 | 53.33 | 53.33 | 0.00 | 0.00 |
| North Texas | CUSA | 0.03 | 0.03 | 43.33 | 43.33 | -0.00 | -0.00 |
| Old Dominion | CUSA | 0.03 | 0.03 | 78.12 | 78.12 | 0.02 | 0.02 |
| Rice | CUSA | 0.03 | 0.03 | 17.24 | 17.24 | -0.02 | -0.02 |
| South Alabama | SB | 0.03 | 0.03 | 40.00 | 40.00 | -0.01 | -0.01 |
| TCU | B12 | 0.03 | 0.03 | 65.62 | 65.62 | 0.01 | 0.01 |
| UMKC | WAC | 0.03 | 0.03 | 27.59 | 27.59 | -0.01 | -0.01 |
| Colorado | P12 | 0.03 | 0.03 | 53.12 | 53.12 | 0.00 | 0.00 |
| Howard | MEAC | 0.03 | 0.03 | 25.81 | 25.81 | -0.01 | -0.01 |
| Louisville | ACC | 0.03 | 0.03 | 60.61 | 60.61 | 0.01 | 0.01 |
| Nebraska | B10 | 0.03 | 0.03 | 68.75 | 68.75 | 0.01 | 0.01 |
| Oregon | P12 | 0.03 | 0.03 | 64.71 | 64.71 | 0.01 | 0.01 |
| Penn St. | B10 | 0.03 | 0.03 | 61.76 | 61.76 | 0.01 | 0.01 |
| Pepperdine | WCC | 0.03 | 0.03 | 16.13 | 16.13 | -0.02 | -0.02 |
| Portland | WCC | 0.03 | 0.03 | 24.14 | 24.14 | -0.01 | -0.01 |
| South Florida | Amer | 0.03 | 0.03 | 31.25 | 31.25 | -0.01 | -0.01 |
| Tennessee Tech | OVC | 0.03 | 0.03 | 54.84 | 54.84 | 0.00 | 0.00 |
| Arkansas Pine Bluff | SWAC | 0.03 | 0.03 | 40.00 | 40.00 | -0.01 | -0.01 |
| Evansville | MVC | 0.03 | 0.03 | 50.00 | 50.00 | 0.00 | 0.00 |
| Manhattan | MAAC | 0.03 | 0.03 | 45.16 | 45.16 | -0.00 | -0.00 |
| Pacific | WCC | 0.03 | 0.03 | 41.94 | 41.94 | -0.00 | -0.00 |
| St. Bonaventure | A10 | 0.03 | 0.03 | 78.12 | 78.12 | 0.01 | 0.01 |
| Tennessee St. | OVC | 0.03 | 0.03 | 46.43 | 46.43 | -0.00 | -0.00 |
| Texas St. | SB | 0.03 | 0.03 | 41.94 | 41.94 | -0.00 | -0.00 |
| Drexel | CAA | 0.03 | 0.03 | 37.50 | 37.50 | -0.01 | -0.01 |
| Duquesne | A10 | 0.03 | 0.03 | 50.00 | 50.00 | 0.00 | 0.00 |
| Furman | SC | 0.03 | 0.03 | 67.74 | 67.74 | 0.01 | 0.01 |
| Grand Canyon | WAC | 0.03 | 0.03 | 65.62 | 65.62 | 0.01 | 0.01 |
| Kennesaw St. | ASun | 0.03 | 0.03 | 28.57 | 28.57 | -0.01 | -0.01 |
| Little Rock | SB | 0.03 | 0.03 | 20.00 | 20.00 | -0.02 | -0.02 |
| New Hampshire | AE | 0.03 | 0.03 | 27.59 | 27.59 | -0.01 | -0.01 |
| North Carolina St. | ACC | 0.03 | 0.03 | 65.62 | 65.62 | 0.01 | 0.01 |
| Oregon St. | P12 | 0.03 | 0.03 | 50.00 | 50.00 | 0.00 | 0.00 |
| Princeton | Ivy | 0.03 | 0.03 | 42.86 | 42.86 | -0.00 | -0.00 |
| San Diego | WCC | 0.03 | 0.03 | 56.67 | 56.67 | 0.00 | 0.00 |
| San Diego St. | MWC | 0.03 | 0.03 | 67.74 | 67.74 | 0.01 | 0.01 |
| Southeastern Louisiana | Slnd | 0.03 | 0.03 | 63.33 | 63.33 | 0.01 | 0.01 |
| Texas | B12 | 0.03 | 0.03 | 57.58 | 57.58 | 0.00 | 0.00 |
| UC Irvine | BW | 0.03 | 0.03 | 48.48 | 48.48 | -0.00 | -0.00 |