
 - Blog
| Conference: | Horz |
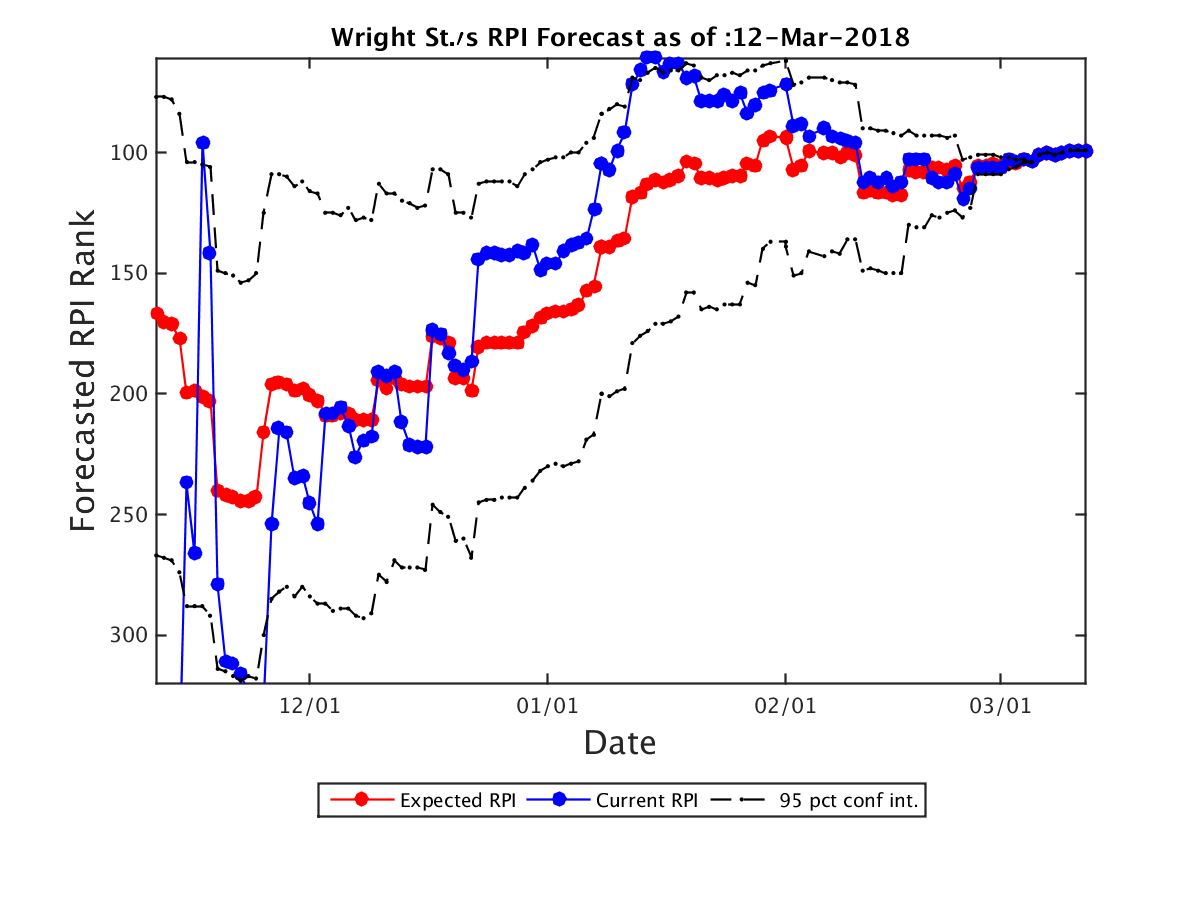
| Expected RPI: | 99.0 |
| Current RPI: | 99 |
| Expected SOS: | 238 |
| Current SOS: | 238 |
| Current Record: | 23-9 |
| Expected Record: | 23-9 |
| Current Conf Record: | 17-4 |
| Expected Conf Record: | 17-4 |
| Expected Record vs RPI 1-25: | 0-1 |
| Expected Record vs RPI 26-50: | 0-2 |
| Expected Record vs RPI 51-100: | 1-0 |
| Expected Record vs RPI 101-200: | 7-2 |
| Expected Record vs RPI 200+: | 15-4 |
| Current OOC Record: | 6-5 |
| Expected OOC Record: | 6-5 |
| Expected OOC RPI: | 76 |
| Expected OOC SOS: | 49 |
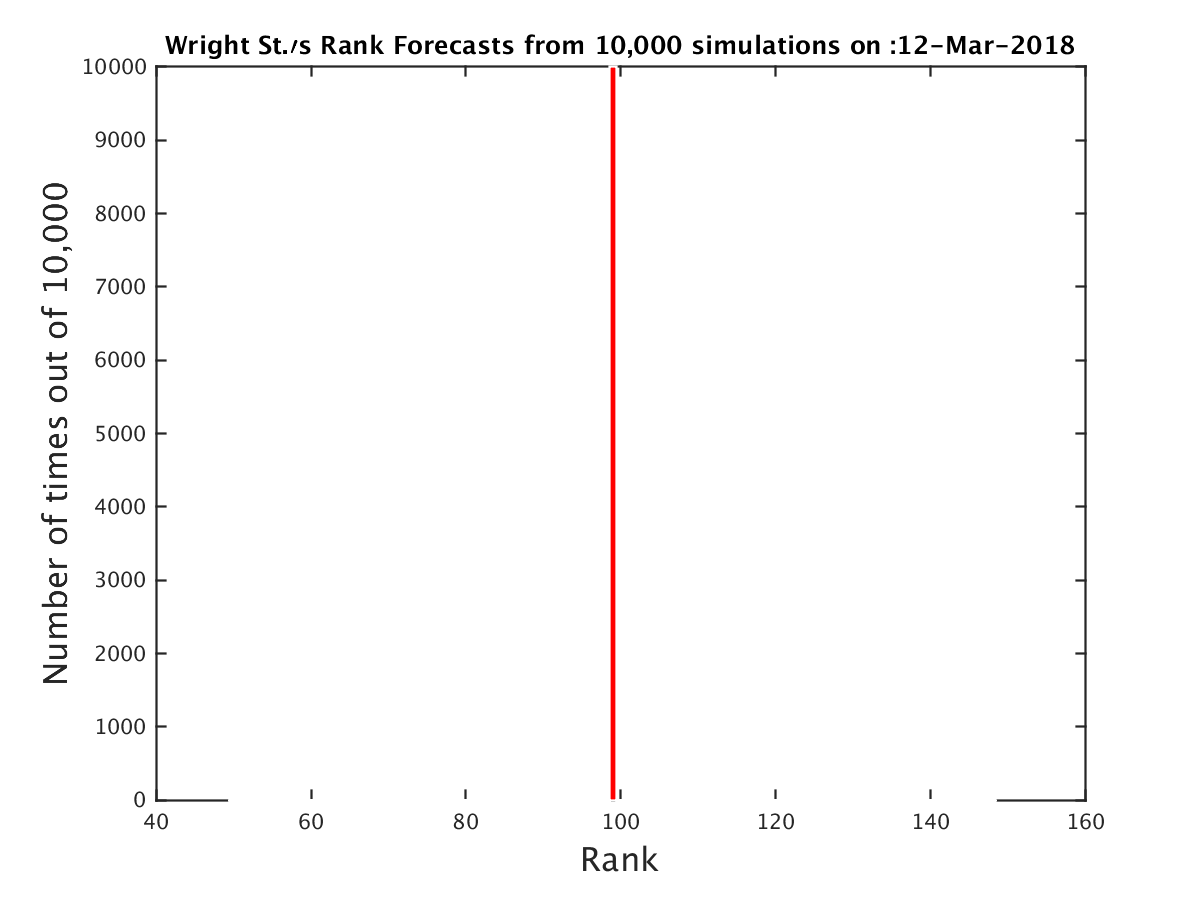
| Final Record | Expected RPI | Probability |
|---|---|---|
| 23-9 | 99.0 | 100.00% |
| Date | Opponent (Expected RPI) | Conf | Location | Score | Outcome | Prob(W) | Spread |
|---|---|---|---|---|---|---|---|
| 11-10 | Loyola Chicago (22.0) | MVC | A | 84-80 | L | 0% | 0.0 |
| 11-14 | Miami OH (159.0) | MAC | A | 73-67 | L | 0% | 0.0 |
| 11-18 | Murray St. (48.0) | OVC | H | 61-80 | L | 0% | 0.0 |
| 11-24 | Gardner Webb (244.0) | BSth | H | 67-47 | W | 100% | 0.0 |
| 11-25 | Jacksonville (286.0) | ASun | H | 68-44 | W | 100% | 0.0 |
| 11-26 | Fairfield (180.0) | MAAC | H | 57-56 | W | 100% | 0.0 |
| 12-2 | Western Kentucky (39.0) | CUSA | A | 78-60 | L | 0% | 0.0 |
| 12-9 | Kent St. (154.0) | MAC | H | 63-54 | W | 100% | 0.0 |
| 12-16 | Toledo (75.0) | MAC | A | 69-77 | W | 100% | 0.0 |
| 12-19 | Missouri St. (136.0) | MVC | A | 66-50 | L | 0% | 0.0 |
| 12-22 | Georgia Tech (161.0) | ACC | A | 81-85 | W | 100% | 0.0 |
| 12-28 | Illinois Chicago (236.0) | Horz | H | 65-61 | W | 100% | 0.0 |
| 12-30 | IUPUI (294.0) | Horz | H | 60-52 | W | 100% | 0.0 |
| 1-5 | Detroit (318.0) | Horz | A | 73-80 | W | 100% | 0.0 |
| 1-7 | Oakland (182.0) | Horz | A | 81-86 | W | 100% | 0.0 |
| 1-11 | Northern Kentucky (115.0) | Horz | A | 81-84 | W | 100% | 0.0 |
| 1-15 | Youngstown St. (329.0) | Horz | H | 77-67 | W | 100% | 0.0 |
| 1-18 | Green Bay (303.0) | Horz | A | 67-80 | W | 100% | 0.0 |
| 1-20 | Milwaukee (231.0) | Horz | A | 66-61 | L | 0% | 0.0 |
| 1-26 | Detroit (318.0) | Horz | H | 87-55 | W | 100% | 0.0 |
| 1-28 | Oakland (182.0) | Horz | H | 64-51 | W | 100% | 0.0 |
| 2-1 | Cleveland St. (282.0) | Horz | A | 77-74 | L | 0% | 0.0 |
| 2-3 | Youngstown St. (329.0) | Horz | A | 57-83 | W | 100% | 0.0 |
| 2-8 | Green Bay (303.0) | Horz | H | 68-64 | W | 100% | 0.0 |
| 2-10 | Milwaukee (231.0) | Horz | H | 73-74 | L | 0% | 0.0 |
| 2-16 | Northern Kentucky (115.0) | Horz | H | 69-67 | W | 100% | 0.0 |
| 2-19 | Cleveland St. (282.0) | Horz | H | 72-63 | W | 100% | 0.0 |
| 2-23 | IUPUI (294.0) | Horz | A | 66-56 | L | 0% | 0.0 |
| 2-25 | Illinois Chicago (236.0) | Horz | A | 81-88 | W | 100% | 0.0 |
| 3-3 | Green Bay (303.0) | Horz | N | 87-72 | W | 100% | 0.0 |
| 3-5 | Milwaukee (231.0) | Horz | N | 59-53 | W | 100% | 0.0 |
| 3-6 | Cleveland St. (282.0) | Horz | N | 74-57 | W | 100% | 0.0 |
| Team | Conf | Curr Wgt | Fut Wgt | Curr W/L | Exp W/L | Curr Impact | Exp Impact |
|---|---|---|---|---|---|---|---|
| Wright St. | Horz | 26.57 | 26.57 | 75.35 | 75.35 | 13.47 | 13.47 |
| Cleveland St. | Horz | 5.82 | 5.82 | 32.26 | 32.26 | -2.07 | -2.07 |
| Milwaukee | Horz | 5.71 | 5.71 | 46.43 | 46.43 | -0.41 | -0.41 |
| Green Bay | Horz | 5.66 | 5.66 | 37.04 | 37.04 | -1.47 | -1.47 |
| Oakland | Horz | 4.25 | 4.25 | 61.29 | 61.29 | 0.96 | 0.96 |
| Detroit | Horz | 4.22 | 4.22 | 21.43 | 21.43 | -2.41 | -2.41 |
| Illinois Chicago | Horz | 4.19 | 4.19 | 53.57 | 53.57 | 0.30 | 0.30 |
| Youngstown St. | Horz | 4.19 | 4.19 | 21.43 | 21.43 | -2.39 | -2.39 |
| Northern Kentucky | Horz | 4.16 | 4.16 | 74.07 | 74.07 | 2.00 | 2.00 |
| IUPUI | Horz | 4.13 | 4.13 | 30.77 | 30.77 | -1.59 | -1.59 |
| Toledo | MAC | 1.80 | 1.80 | 68.75 | 68.75 | 0.68 | 0.68 |
| Kent St. | MAC | 1.78 | 1.78 | 50.00 | 50.00 | 0.00 | 0.00 |
| Loyola Chicago | MVC | 1.76 | 1.76 | 83.87 | 83.87 | 1.19 | 1.19 |
| Jacksonville | ASun | 1.69 | 1.69 | 39.29 | 39.29 | -0.36 | -0.36 |
| Miami OH | MAC | 1.66 | 1.66 | 43.33 | 43.33 | -0.22 | -0.22 |
| Missouri St. | MVC | 1.64 | 1.64 | 51.61 | 51.61 | 0.05 | 0.05 |
| Fairfield | MAAC | 1.62 | 1.62 | 53.12 | 53.12 | 0.10 | 0.10 |
| Murray St. | OVC | 1.61 | 1.61 | 82.14 | 82.14 | 1.04 | 1.04 |
| Gardner Webb | BSth | 1.61 | 1.61 | 39.29 | 39.29 | -0.35 | -0.35 |
| Western Kentucky | CUSA | 1.59 | 1.59 | 68.75 | 68.75 | 0.60 | 0.60 |
| Georgia Tech | ACC | 1.56 | 1.56 | 41.94 | 41.94 | -0.25 | -0.25 |
| Western Michigan | MAC | 0.37 | 0.37 | 50.00 | 50.00 | 0.00 | 0.00 |
| Northern Illinois | MAC | 0.33 | 0.33 | 36.67 | 36.67 | -0.09 | -0.09 |
| Eastern Michigan | MAC | 0.24 | 0.24 | 58.62 | 58.62 | 0.04 | 0.04 |
| Belmont | OVC | 0.23 | 0.23 | 72.73 | 72.73 | 0.11 | 0.11 |
| Akron | MAC | 0.21 | 0.21 | 41.94 | 41.94 | -0.03 | -0.03 |
| Illinois St. | MVC | 0.20 | 0.20 | 53.12 | 53.12 | 0.01 | 0.01 |
| Bowling Green | MAC | 0.20 | 0.20 | 46.67 | 46.67 | -0.01 | -0.01 |
| Indiana St. | MVC | 0.20 | 0.20 | 37.93 | 37.93 | -0.05 | -0.05 |
| Ball St. | MAC | 0.20 | 0.20 | 58.06 | 58.06 | 0.03 | 0.03 |
| Ohio | MAC | 0.19 | 0.19 | 43.33 | 43.33 | -0.03 | -0.03 |
| Eastern Illinois | OVC | 0.19 | 0.19 | 34.48 | 34.48 | -0.06 | -0.06 |
| Bradley | MVC | 0.18 | 0.18 | 59.38 | 59.38 | 0.03 | 0.03 |
| Wisconsin | B10 | 0.18 | 0.18 | 45.45 | 45.45 | -0.02 | -0.02 |
| Fort Wayne | Sum | 0.18 | 0.18 | 50.00 | 50.00 | 0.00 | 0.00 |
| Buffalo | MAC | 0.17 | 0.17 | 75.76 | 75.76 | 0.09 | 0.09 |
| East Tennessee St. | SC | 0.16 | 0.16 | 71.88 | 71.88 | 0.07 | 0.07 |
| Western Illinois | Sum | 0.16 | 0.16 | 33.33 | 33.33 | -0.05 | -0.05 |
| Southern Illinois | MVC | 0.15 | 0.15 | 59.38 | 59.38 | 0.03 | 0.03 |
| Valparaiso | MVC | 0.15 | 0.15 | 43.33 | 43.33 | -0.02 | -0.02 |
| Niagara | MAAC | 0.14 | 0.14 | 59.38 | 59.38 | 0.03 | 0.03 |
| Morehead St. | OVC | 0.14 | 0.14 | 22.22 | 22.22 | -0.08 | -0.08 |
| Stetson | ASun | 0.13 | 0.13 | 28.57 | 28.57 | -0.06 | -0.06 |
| Eastern Kentucky | OVC | 0.13 | 0.13 | 31.03 | 31.03 | -0.05 | -0.05 |
| Florida A&M | MEAC | 0.13 | 0.13 | 24.24 | 24.24 | -0.07 | -0.07 |
| DePaul | BE | 0.13 | 0.13 | 35.48 | 35.48 | -0.04 | -0.04 |
| Iona | MAAC | 0.12 | 0.12 | 60.61 | 60.61 | 0.03 | 0.03 |
| Northern Iowa | MVC | 0.12 | 0.12 | 46.67 | 46.67 | -0.01 | -0.01 |
| Central Michigan | MAC | 0.12 | 0.12 | 53.33 | 53.33 | 0.01 | 0.01 |
| Michigan St. | B10 | 0.12 | 0.12 | 87.88 | 87.88 | 0.09 | 0.09 |
| SIU Edwardsville | OVC | 0.11 | 0.11 | 30.00 | 30.00 | -0.04 | -0.04 |
| Missouri | SEC | 0.10 | 0.10 | 61.29 | 61.29 | 0.02 | 0.02 |
| Purdue | B10 | 0.10 | 0.10 | 82.35 | 82.35 | 0.07 | 0.07 |
| Austin Peay | OVC | 0.10 | 0.10 | 53.33 | 53.33 | 0.01 | 0.01 |
| FIU | CUSA | 0.10 | 0.10 | 37.93 | 37.93 | -0.02 | -0.02 |
| Marist | MAAC | 0.10 | 0.10 | 19.35 | 19.35 | -0.06 | -0.06 |
| UAB | CUSA | 0.10 | 0.10 | 58.06 | 58.06 | 0.02 | 0.02 |
| Drake | MVC | 0.10 | 0.10 | 48.39 | 48.39 | -0.00 | -0.00 |
| Evansville | MVC | 0.10 | 0.10 | 50.00 | 50.00 | 0.00 | 0.00 |
| Syracuse | ACC | 0.10 | 0.10 | 60.61 | 60.61 | 0.02 | 0.02 |
| Marshall | CUSA | 0.09 | 0.09 | 69.70 | 69.70 | 0.04 | 0.04 |
| Old Dominion | CUSA | 0.09 | 0.09 | 78.12 | 78.12 | 0.05 | 0.05 |
| Coppin St. | MEAC | 0.09 | 0.09 | 15.62 | 15.62 | -0.06 | -0.06 |
| Jacksonville St. | OVC | 0.08 | 0.08 | 62.50 | 62.50 | 0.02 | 0.02 |
| Kennesaw St. | ASun | 0.08 | 0.08 | 28.57 | 28.57 | -0.03 | -0.03 |
| Lipscomb | ASun | 0.08 | 0.08 | 68.97 | 68.97 | 0.03 | 0.03 |
| USC Upstate | ASun | 0.08 | 0.08 | 10.71 | 10.71 | -0.06 | -0.06 |
| Winthrop | BSth | 0.08 | 0.08 | 57.14 | 57.14 | 0.01 | 0.01 |
| Michigan | B10 | 0.08 | 0.08 | 79.41 | 79.41 | 0.05 | 0.05 |
| Saint Louis | A10 | 0.08 | 0.08 | 50.00 | 50.00 | 0.00 | 0.00 |
| Mississippi St. | SEC | 0.08 | 0.08 | 65.62 | 65.62 | 0.02 | 0.02 |
| UCLA | P12 | 0.08 | 0.08 | 65.62 | 65.62 | 0.02 | 0.02 |
| Virginia Tech | ACC | 0.08 | 0.08 | 65.62 | 65.62 | 0.02 | 0.02 |
| Canisius | MAAC | 0.08 | 0.08 | 65.62 | 65.62 | 0.02 | 0.02 |
| Saint Joseph's | A10 | 0.08 | 0.08 | 50.00 | 50.00 | 0.00 | 0.00 |
| Southern Miss | CUSA | 0.08 | 0.08 | 40.00 | 40.00 | -0.02 | -0.02 |
| Elon | CAA | 0.08 | 0.08 | 40.00 | 40.00 | -0.02 | -0.02 |
| Iowa St. | B12 | 0.08 | 0.08 | 41.94 | 41.94 | -0.01 | -0.01 |
| Montana St. | BSky | 0.08 | 0.08 | 36.67 | 36.67 | -0.02 | -0.02 |
| Middle Tennessee | CUSA | 0.07 | 0.07 | 76.67 | 76.67 | 0.04 | 0.04 |
| Manhattan | MAAC | 0.07 | 0.07 | 45.16 | 45.16 | -0.01 | -0.01 |
| Oral Roberts | Sum | 0.07 | 0.07 | 28.57 | 28.57 | -0.03 | -0.03 |
| Kansas | B12 | 0.07 | 0.07 | 79.41 | 79.41 | 0.04 | 0.04 |
| Quinnipiac | MAAC | 0.07 | 0.07 | 36.36 | 36.36 | -0.02 | -0.02 |
| Texas Southern | SWAC | 0.07 | 0.07 | 44.12 | 44.12 | -0.01 | -0.01 |
| Arkansas St. | SB | 0.07 | 0.07 | 30.00 | 30.00 | -0.03 | -0.03 |
| Central Connecticut | NEC | 0.07 | 0.07 | 43.75 | 43.75 | -0.01 | -0.01 |
| Cincinnati | Amer | 0.07 | 0.07 | 88.24 | 88.24 | 0.05 | 0.05 |
| East Carolina | Amer | 0.07 | 0.07 | 33.33 | 33.33 | -0.02 | -0.02 |
| Rutgers | B10 | 0.07 | 0.07 | 42.42 | 42.42 | -0.01 | -0.01 |
| Gonzaga | WCC | 0.06 | 0.06 | 88.24 | 88.24 | 0.04 | 0.04 |
| Washington St. | P12 | 0.06 | 0.06 | 38.71 | 38.71 | -0.01 | -0.01 |
| Auburn | SEC | 0.05 | 0.05 | 78.12 | 78.12 | 0.03 | 0.03 |
| Campbell | BSth | 0.05 | 0.05 | 46.43 | 46.43 | -0.00 | -0.00 |
| Charleston Southern | BSth | 0.05 | 0.05 | 42.86 | 42.86 | -0.01 | -0.01 |
| Florida Gulf Coast | ASun | 0.05 | 0.05 | 64.52 | 64.52 | 0.02 | 0.02 |
| High Point | BSth | 0.05 | 0.05 | 40.74 | 40.74 | -0.01 | -0.01 |
| James Madison | CAA | 0.05 | 0.05 | 29.03 | 29.03 | -0.02 | -0.02 |
| Liberty | BSth | 0.05 | 0.05 | 54.84 | 54.84 | 0.01 | 0.01 |
| Longwood | BSth | 0.05 | 0.05 | 13.33 | 13.33 | -0.04 | -0.04 |
| Memphis | Amer | 0.05 | 0.05 | 61.76 | 61.76 | 0.01 | 0.01 |
| NJIT | ASun | 0.05 | 0.05 | 42.86 | 42.86 | -0.01 | -0.01 |
| North Florida | ASun | 0.05 | 0.05 | 36.67 | 36.67 | -0.01 | -0.01 |
| Presbyterian | BSth | 0.05 | 0.05 | 27.59 | 27.59 | -0.02 | -0.02 |
| Radford | BSth | 0.05 | 0.05 | 62.50 | 62.50 | 0.01 | 0.01 |
| Southeast Missouri St. | OVC | 0.05 | 0.05 | 41.38 | 41.38 | -0.01 | -0.01 |
| Tennessee Martin | OVC | 0.05 | 0.05 | 27.59 | 27.59 | -0.02 | -0.02 |
| Tennessee Tech | OVC | 0.05 | 0.05 | 54.84 | 54.84 | 0.01 | 0.01 |
| Texas A&M | SEC | 0.05 | 0.05 | 62.50 | 62.50 | 0.01 | 0.01 |
| UMBC | AE | 0.05 | 0.05 | 67.74 | 67.74 | 0.02 | 0.02 |
| UNC Asheville | BSth | 0.05 | 0.05 | 61.29 | 61.29 | 0.01 | 0.01 |
| Vermont | AE | 0.05 | 0.05 | 78.79 | 78.79 | 0.03 | 0.03 |
| Butler | BE | 0.05 | 0.05 | 60.61 | 60.61 | 0.01 | 0.01 |
| Dartmouth | Ivy | 0.05 | 0.05 | 23.08 | 23.08 | -0.03 | -0.03 |
| Delaware St. | MEAC | 0.05 | 0.05 | 6.67 | 6.67 | -0.05 | -0.05 |
| Houston Baptist | Slnd | 0.05 | 0.05 | 10.71 | 10.71 | -0.04 | -0.04 |
| Idaho St. | BSky | 0.05 | 0.05 | 42.86 | 42.86 | -0.01 | -0.01 |
| Indiana | B10 | 0.05 | 0.05 | 51.61 | 51.61 | 0.00 | 0.00 |
| Kentucky | SEC | 0.05 | 0.05 | 70.59 | 70.59 | 0.02 | 0.02 |
| North Carolina Central | MEAC | 0.05 | 0.05 | 51.61 | 51.61 | 0.00 | 0.00 |
| Northern Colorado | BSky | 0.05 | 0.05 | 61.29 | 61.29 | 0.01 | 0.01 |
| Robert Morris | NEC | 0.05 | 0.05 | 48.48 | 48.48 | -0.00 | -0.00 |
| Seattle | WAC | 0.05 | 0.05 | 56.67 | 56.67 | 0.01 | 0.01 |
| South Dakota | Sum | 0.05 | 0.05 | 73.33 | 73.33 | 0.02 | 0.02 |
| Troy | SB | 0.05 | 0.05 | 45.16 | 45.16 | -0.01 | -0.01 |
| Utah St. | MWC | 0.05 | 0.05 | 48.48 | 48.48 | -0.00 | -0.00 |
| Bethune Cookman | MEAC | 0.05 | 0.05 | 53.33 | 53.33 | 0.00 | 0.00 |
| Florida | SEC | 0.05 | 0.05 | 62.50 | 62.50 | 0.01 | 0.01 |
| Hampton | MEAC | 0.05 | 0.05 | 51.61 | 51.61 | 0.00 | 0.00 |
| Miami FL | ACC | 0.05 | 0.05 | 70.97 | 70.97 | 0.02 | 0.02 |
| North Carolina St. | ACC | 0.05 | 0.05 | 65.62 | 65.62 | 0.02 | 0.02 |
| LIU Brooklyn | NEC | 0.05 | 0.05 | 51.52 | 51.52 | 0.00 | 0.00 |
| Boston College | ACC | 0.05 | 0.05 | 55.88 | 55.88 | 0.01 | 0.01 |
| Clemson | ACC | 0.05 | 0.05 | 71.88 | 71.88 | 0.02 | 0.02 |
| North Dakota St. | Sum | 0.05 | 0.05 | 41.38 | 41.38 | -0.01 | -0.01 |
| Notre Dame | ACC | 0.05 | 0.05 | 57.58 | 57.58 | 0.01 | 0.01 |
| Virginia | ACC | 0.05 | 0.05 | 93.94 | 93.94 | 0.04 | 0.04 |
| Wake Forest | ACC | 0.05 | 0.05 | 35.48 | 35.48 | -0.01 | -0.01 |
| Florida Atlantic | CUSA | 0.05 | 0.05 | 32.14 | 32.14 | -0.02 | -0.02 |
| Mississippi Valley St. | SWAC | 0.05 | 0.05 | 12.50 | 12.50 | -0.04 | -0.04 |
| Norfolk St. | MEAC | 0.05 | 0.05 | 43.33 | 43.33 | -0.01 | -0.01 |
| North Texas | CUSA | 0.05 | 0.05 | 43.33 | 43.33 | -0.01 | -0.01 |
| Charlotte | CUSA | 0.05 | 0.05 | 17.86 | 17.86 | -0.03 | -0.03 |
| Chicago St. | WAC | 0.05 | 0.05 | 3.33 | 3.33 | -0.04 | -0.04 |
| Monmouth | MAAC | 0.05 | 0.05 | 35.48 | 35.48 | -0.01 | -0.01 |
| New Orleans | Slnd | 0.05 | 0.05 | 42.86 | 42.86 | -0.01 | -0.01 |
| Penn | Ivy | 0.05 | 0.05 | 74.19 | 74.19 | 0.02 | 0.02 |
| Rider | MAAC | 0.05 | 0.05 | 70.97 | 70.97 | 0.02 | 0.02 |
| Siena | MAAC | 0.05 | 0.05 | 25.00 | 25.00 | -0.02 | -0.02 |
| Towson | CAA | 0.05 | 0.05 | 53.33 | 53.33 | 0.00 | 0.00 |
| Georgetown | BE | 0.03 | 0.03 | 50.00 | 50.00 | 0.00 | 0.00 |
| Maryland | B10 | 0.03 | 0.03 | 58.06 | 58.06 | 0.00 | 0.00 |
| North Carolina A&T | MEAC | 0.03 | 0.03 | 56.25 | 56.25 | 0.00 | 0.00 |
| Northern Arizona | BSky | 0.03 | 0.03 | 13.33 | 13.33 | -0.02 | -0.02 |
| South Carolina St. | MEAC | 0.03 | 0.03 | 26.67 | 26.67 | -0.01 | -0.01 |
| Tennessee St. | OVC | 0.03 | 0.03 | 46.43 | 46.43 | -0.00 | -0.00 |
| UCF | Amer | 0.03 | 0.03 | 59.38 | 59.38 | 0.01 | 0.01 |
| Fordham | A10 | 0.03 | 0.03 | 29.03 | 29.03 | -0.01 | -0.01 |
| Hartford | AE | 0.03 | 0.03 | 58.06 | 58.06 | 0.00 | 0.00 |
| Ohio St. | B10 | 0.03 | 0.03 | 75.00 | 75.00 | 0.01 | 0.01 |
| Tulane | Amer | 0.03 | 0.03 | 45.16 | 45.16 | -0.00 | -0.00 |
| Boise St. | MWC | 0.02 | 0.02 | 73.33 | 73.33 | 0.01 | 0.01 |
| Colorado St. | MWC | 0.02 | 0.02 | 32.26 | 32.26 | -0.01 | -0.01 |
| Duke | ACC | 0.02 | 0.02 | 78.79 | 78.79 | 0.01 | 0.01 |
| Florida St. | ACC | 0.02 | 0.02 | 64.52 | 64.52 | 0.01 | 0.01 |
| Georgia | SEC | 0.02 | 0.02 | 54.55 | 54.55 | 0.00 | 0.00 |
| Georgia Southern | SB | 0.02 | 0.02 | 61.29 | 61.29 | 0.01 | 0.01 |
| Grambling St. | SWAC | 0.02 | 0.02 | 53.33 | 53.33 | 0.00 | 0.00 |
| Louisville | ACC | 0.02 | 0.02 | 60.61 | 60.61 | 0.01 | 0.01 |
| North Carolina | ACC | 0.02 | 0.02 | 71.43 | 71.43 | 0.01 | 0.01 |
| Northwestern | B10 | 0.02 | 0.02 | 45.16 | 45.16 | -0.00 | -0.00 |
| Pittsburgh | ACC | 0.02 | 0.02 | 25.00 | 25.00 | -0.01 | -0.01 |
| Samford | SC | 0.02 | 0.02 | 26.67 | 26.67 | -0.01 | -0.01 |
| South Dakota St. | Sum | 0.02 | 0.02 | 80.00 | 80.00 | 0.01 | 0.01 |
| Southern | SWAC | 0.02 | 0.02 | 41.94 | 41.94 | -0.00 | -0.00 |
| Tennessee | SEC | 0.02 | 0.02 | 75.76 | 75.76 | 0.01 | 0.01 |
| UMKC | WAC | 0.02 | 0.02 | 27.59 | 27.59 | -0.01 | -0.01 |
| UNC Wilmington | CAA | 0.02 | 0.02 | 30.00 | 30.00 | -0.01 | -0.01 |
| UT Rio Grande Valley | WAC | 0.02 | 0.02 | 43.33 | 43.33 | -0.00 | -0.00 |
| Wofford | SC | 0.02 | 0.02 | 60.00 | 60.00 | 0.00 | 0.00 |
| Yale | Ivy | 0.02 | 0.02 | 50.00 | 50.00 | 0.00 | 0.00 |
| Albany | AE | 0.02 | 0.02 | 67.74 | 67.74 | 0.01 | 0.01 |
| Cornell | Ivy | 0.02 | 0.02 | 40.74 | 40.74 | -0.00 | -0.00 |
| Houston | Amer | 0.02 | 0.02 | 78.79 | 78.79 | 0.01 | 0.01 |
| Jackson St. | SWAC | 0.02 | 0.02 | 33.33 | 33.33 | -0.01 | -0.01 |
| Louisiana Tech | CUSA | 0.02 | 0.02 | 48.39 | 48.39 | -0.00 | -0.00 |
| Loyola MD | Pat | 0.02 | 0.02 | 26.67 | 26.67 | -0.01 | -0.01 |
| New Hampshire | AE | 0.02 | 0.02 | 27.59 | 27.59 | -0.01 | -0.01 |
| Nicholls St. | Slnd | 0.02 | 0.02 | 60.71 | 60.71 | 0.01 | 0.01 |
| Northeastern | CAA | 0.02 | 0.02 | 68.75 | 68.75 | 0.01 | 0.01 |
| Oregon St. | P12 | 0.02 | 0.02 | 50.00 | 50.00 | 0.00 | 0.00 |
| Rice | CUSA | 0.02 | 0.02 | 17.24 | 17.24 | -0.02 | -0.02 |
| Saint Peter's | MAAC | 0.02 | 0.02 | 43.75 | 43.75 | -0.00 | -0.00 |
| SMU | Amer | 0.02 | 0.02 | 51.52 | 51.52 | 0.00 | 0.00 |
| Southeastern Louisiana | Slnd | 0.02 | 0.02 | 63.33 | 63.33 | 0.01 | 0.01 |
| UTEP | CUSA | 0.02 | 0.02 | 33.33 | 33.33 | -0.01 | -0.01 |
| UTSA | CUSA | 0.02 | 0.02 | 53.33 | 53.33 | 0.00 | 0.00 |
| Villanova | BE | 0.02 | 0.02 | 88.24 | 88.24 | 0.02 | 0.02 |
| Wagner | NEC | 0.02 | 0.02 | 70.00 | 70.00 | 0.01 | 0.01 |
| Xavier | BE | 0.02 | 0.02 | 84.85 | 84.85 | 0.02 | 0.02 |