
 - Blog
| Conference: | BW |
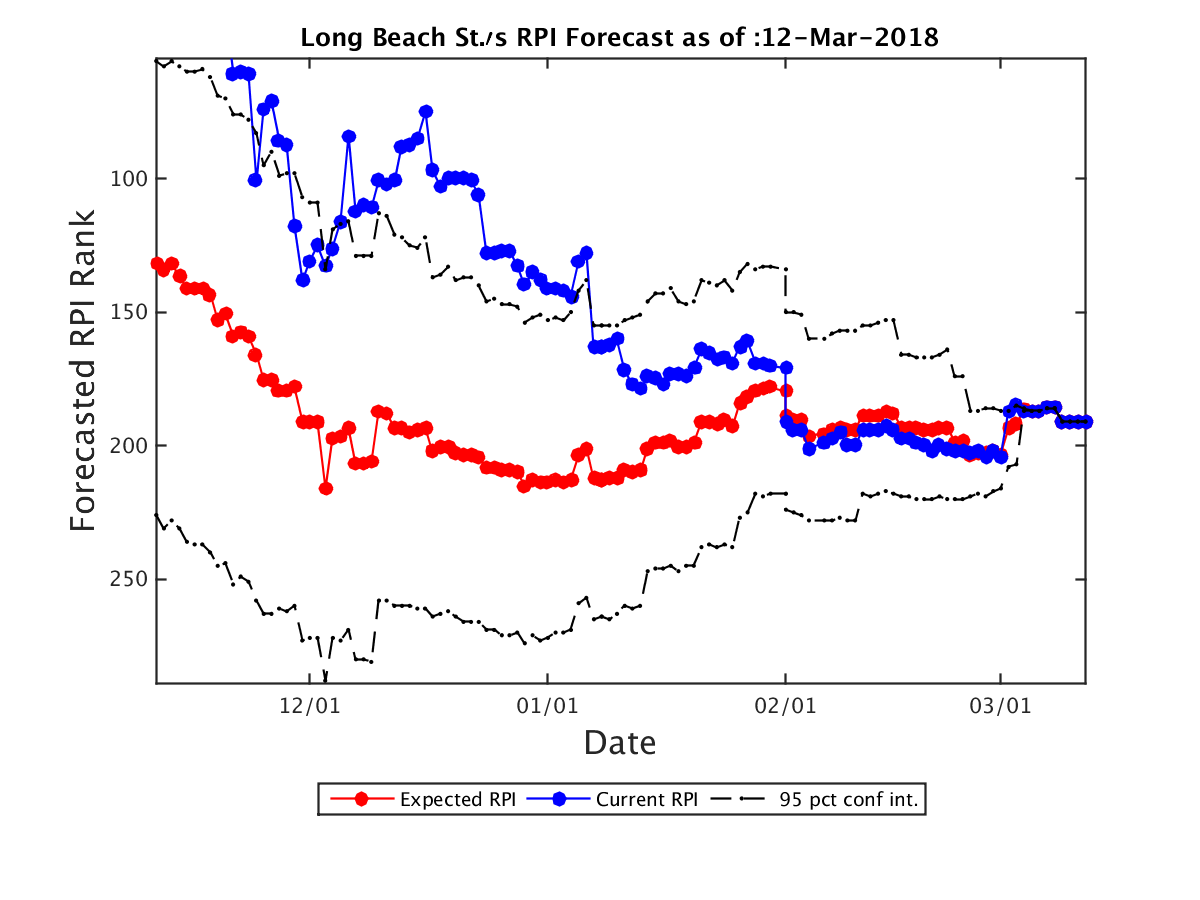
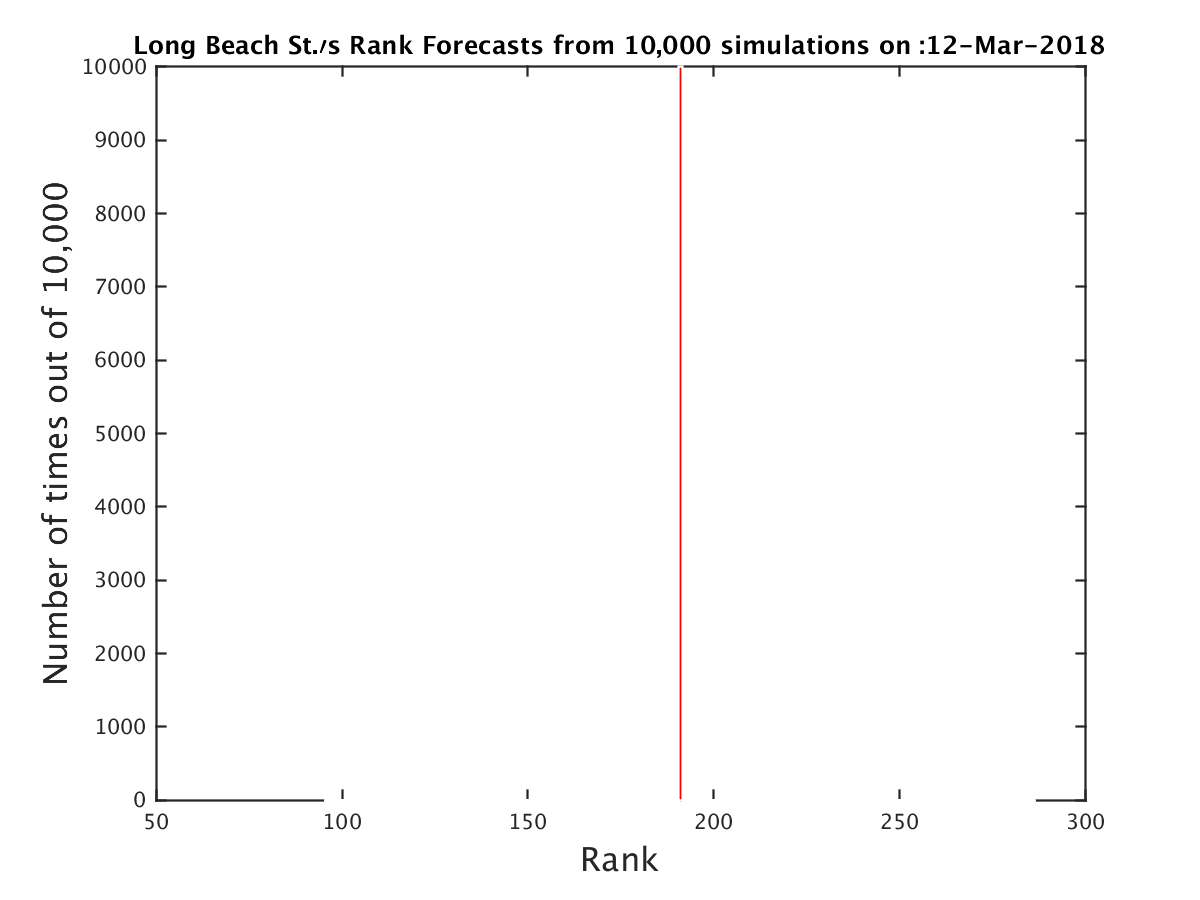
| Expected RPI: | 191.0 |
| Current RPI: | 191 |
| Expected SOS: | 140 |
| Current SOS: | 140 |
| Current Record: | 13-18 |
| Expected Record: | 13-18 |
| Current Conf Record: | 9-8 |
| Expected Conf Record: | 9-8 |
| Expected Record vs RPI 1-25: | 0-2 |
| Expected Record vs RPI 26-50: | 0-2 |
| Expected Record vs RPI 51-100: | 1-1 |
| Expected Record vs RPI 101-200: | 4-10 |
| Expected Record vs RPI 200+: | 8-3 |
| Current OOC Record: | 4-10 |
| Expected OOC Record: | 4-10 |
| Expected OOC RPI: | 175 |
| Expected OOC SOS: | 52 |
| Final Record | Expected RPI | Probability |
|---|---|---|
| 13-18 | 191.0 | 100.00% |
| Date | Opponent (Expected RPI) | Conf | Location | Score | Outcome | Prob(W) | Spread |
|---|---|---|---|---|---|---|---|
| 11-10 | San Francisco (139.0) | WCC | A | 71-83 | W | 100% | 0.0 |
| 11-18 | Oregon St. (137.0) | P12 | A | 89-81 | L | 0% | 0.0 |
| 11-20 | West Virginia (27.0) | B12 | A | 91-62 | L | 0% | 0.0 |
| 11-23 | Missouri (43.0) | SEC | N | 58-95 | L | 0% | 0.0 |
| 11-24 | Oregon St. (137.0) | P12 | N | 69-74 | W | 100% | 0.0 |
| 11-26 | Nebraska (56.0) | B10 | N | 85-80 | L | 0% | 0.0 |
| 11-29 | Arizona (13.0) | P12 | A | 91-56 | L | 0% | 0.0 |
| 12-2 | Fresno St. (103.0) | MWC | H | 70-106 | L | 0% | 0.0 |
| 12-3 | Stanford (86.0) | P12 | H | 76-68 | W | 100% | 0.0 |
| 12-6 | Southern Utah (252.0) | BSky | A | 94-89 | L | 0% | 0.0 |
| 12-9 | Pepperdine (317.0) | WCC | A | 71-78 | W | 100% | 0.0 |
| 12-16 | Eastern Michigan (116.0) | MAC | H | 80-85 | L | 0% | 0.0 |
| 12-21 | Michigan St. (14.0) | B10 | A | 102-60 | L | 0% | 0.0 |
| 12-23 | Colorado St. (234.0) | MWC | A | 68-66 | L | 0% | 0.0 |
| 1-4 | Hawaii (213.0) | BW | H | 89-81 | W | 100% | 0.0 |
| 1-6 | UC Irvine (119.0) | BW | A | 86-73 | L | 0% | 0.0 |
| 1-10 | Cal St. Northridge (340.0) | BW | H | 80-70 | W | 100% | 0.0 |
| 1-13 | UC Riverside (300.0) | BW | A | 68-75 | W | 100% | 0.0 |
| 1-17 | UC Davis (102.0) | BW | A | 84-75 | L | 0% | 0.0 |
| 1-20 | Cal St. Fullerton (131.0) | BW | H | 81-73 | W | 100% | 0.0 |
| 1-25 | Cal Poly (305.0) | BW | A | 71-87 | W | 100% | 0.0 |
| 1-27 | Cal St. Northridge (340.0) | BW | A | 66-70 | W | 100% | 0.0 |
| 1-31 | UC Irvine (119.0) | BW | H | 68-75 | L | 0% | 0.0 |
| 2-3 | UC Davis (102.0) | BW | H | 104-105 | L | 0% | 0.0 |
| 2-10 | Cal Poly (305.0) | BW | H | 73-54 | W | 100% | 0.0 |
| 2-15 | UC Santa Barbara (127.0) | BW | H | 70-80 | L | 0% | 0.0 |
| 2-22 | Hawaii (213.0) | BW | A | 74-63 | L | 0% | 0.0 |
| 2-24 | Cal St. Fullerton (131.0) | BW | A | 81-71 | L | 0% | 0.0 |
| 3-1 | UC Santa Barbara (127.0) | BW | A | 69-70 | W | 100% | 0.0 |
| 3-3 | UC Riverside (300.0) | BW | H | 77-59 | W | 100% | 0.0 |
| 3-8 | Cal St. Fullerton (131.0) | BW | N | 76-74 | L | 0% | 0.0 |
| Team | Conf | Curr Wgt | Fut Wgt | Curr W/L | Exp W/L | Curr Impact | Exp Impact |
|---|---|---|---|---|---|---|---|
| Long Beach St. | BW | 26.42 | 26.42 | 44.83 | 44.83 | -2.73 | -2.73 |
| Cal St. Fullerton | BW | 5.71 | 5.71 | 61.54 | 61.54 | 1.32 | 1.32 |
| UC Irvine | BW | 4.26 | 4.26 | 45.16 | 45.16 | -0.41 | -0.41 |
| UC Davis | BW | 4.22 | 4.22 | 64.29 | 64.29 | 1.20 | 1.20 |
| UC Santa Barbara | BW | 4.21 | 4.21 | 71.43 | 71.43 | 1.80 | 1.80 |
| Cal Poly | BW | 4.18 | 4.18 | 25.93 | 25.93 | -2.01 | -2.01 |
| UC Riverside | BW | 4.13 | 4.13 | 25.93 | 25.93 | -1.99 | -1.99 |
| Hawaii | BW | 4.09 | 4.09 | 53.85 | 53.85 | 0.31 | 0.31 |
| Cal St. Northridge | BW | 4.07 | 4.07 | 15.38 | 15.38 | -2.82 | -2.82 |
| Oregon St. | P12 | 3.32 | 3.32 | 50.00 | 50.00 | 0.00 | 0.00 |
| Pepperdine | WCC | 1.86 | 1.86 | 16.67 | 16.67 | -1.24 | -1.24 |
| San Francisco | WCC | 1.80 | 1.80 | 54.84 | 54.84 | 0.17 | 0.17 |
| Stanford | P12 | 1.79 | 1.79 | 56.25 | 56.25 | 0.22 | 0.22 |
| Fresno St. | MWC | 1.78 | 1.78 | 62.07 | 62.07 | 0.43 | 0.43 |
| Arizona | P12 | 1.76 | 1.76 | 78.79 | 78.79 | 1.01 | 1.01 |
| Southern Utah | BSky | 1.71 | 1.71 | 34.48 | 34.48 | -0.53 | -0.53 |
| Colorado St. | MWC | 1.67 | 1.67 | 30.00 | 30.00 | -0.67 | -0.67 |
| Michigan St. | B10 | 1.66 | 1.66 | 87.50 | 87.50 | 1.25 | 1.25 |
| West Virginia | B12 | 1.64 | 1.64 | 69.70 | 69.70 | 0.65 | 0.65 |
| Nebraska | B10 | 1.64 | 1.64 | 67.74 | 67.74 | 0.58 | 0.58 |
| Missouri | SEC | 1.64 | 1.64 | 60.00 | 60.00 | 0.33 | 0.33 |
| Eastern Michigan | MAC | 1.61 | 1.61 | 57.14 | 57.14 | 0.23 | 0.23 |
| California | P12 | 0.42 | 0.42 | 25.81 | 25.81 | -0.20 | -0.20 |
| USC | P12 | 0.38 | 0.38 | 67.65 | 67.65 | 0.14 | 0.14 |
| Loyola Marymount | WCC | 0.35 | 0.35 | 33.33 | 33.33 | -0.12 | -0.12 |
| Utah Valley | WAC | 0.33 | 0.33 | 65.52 | 65.52 | 0.10 | 0.10 |
| Sacramento St. | BSky | 0.33 | 0.33 | 16.67 | 16.67 | -0.22 | -0.22 |
| Pacific | WCC | 0.32 | 0.32 | 41.94 | 41.94 | -0.05 | -0.05 |
| Montana | BSky | 0.29 | 0.29 | 77.42 | 77.42 | 0.16 | 0.16 |
| Nevada | MWC | 0.29 | 0.29 | 79.41 | 79.41 | 0.17 | 0.17 |
| Washington | P12 | 0.28 | 0.28 | 62.50 | 62.50 | 0.07 | 0.07 |
| Arizona St. | P12 | 0.27 | 0.27 | 64.52 | 64.52 | 0.08 | 0.08 |
| UCLA | P12 | 0.27 | 0.27 | 65.62 | 65.62 | 0.08 | 0.08 |
| Saint Mary's | WCC | 0.26 | 0.26 | 84.85 | 84.85 | 0.18 | 0.18 |
| Washington St. | P12 | 0.23 | 0.23 | 38.71 | 38.71 | -0.05 | -0.05 |
| Oregon | P12 | 0.23 | 0.23 | 64.71 | 64.71 | 0.07 | 0.07 |
| Utah | P12 | 0.21 | 0.21 | 63.33 | 63.33 | 0.05 | 0.05 |
| Idaho St. | BSky | 0.20 | 0.20 | 42.86 | 42.86 | -0.03 | -0.03 |
| Eastern Washington | BSky | 0.19 | 0.19 | 56.25 | 56.25 | 0.02 | 0.02 |
| Portland | WCC | 0.19 | 0.19 | 24.14 | 24.14 | -0.10 | -0.10 |
| Idaho | BSky | 0.19 | 0.19 | 68.97 | 68.97 | 0.07 | 0.07 |
| Santa Clara | WCC | 0.18 | 0.18 | 34.48 | 34.48 | -0.06 | -0.06 |
| Texas A&M | SEC | 0.18 | 0.18 | 62.50 | 62.50 | 0.04 | 0.04 |
| Colorado | P12 | 0.17 | 0.17 | 53.12 | 53.12 | 0.01 | 0.01 |
| Air Force | MWC | 0.16 | 0.16 | 34.48 | 34.48 | -0.05 | -0.05 |
| Northern Colorado | BSky | 0.16 | 0.16 | 61.29 | 61.29 | 0.04 | 0.04 |
| Wyoming | MWC | 0.16 | 0.16 | 59.38 | 59.38 | 0.03 | 0.03 |
| San Diego | WCC | 0.16 | 0.16 | 56.67 | 56.67 | 0.02 | 0.02 |
| Michigan | B10 | 0.15 | 0.15 | 79.41 | 79.41 | 0.09 | 0.09 |
| Utah St. | MWC | 0.15 | 0.15 | 48.48 | 48.48 | -0.00 | -0.00 |
| Central Michigan | MAC | 0.14 | 0.14 | 53.33 | 53.33 | 0.01 | 0.01 |
| Georgia | SEC | 0.14 | 0.14 | 54.55 | 54.55 | 0.01 | 0.01 |
| Arkansas Pine Bluff | SWAC | 0.13 | 0.13 | 40.00 | 40.00 | -0.03 | -0.03 |
| Montana St. | BSky | 0.13 | 0.13 | 36.67 | 36.67 | -0.04 | -0.04 |
| San Diego St. | MWC | 0.13 | 0.13 | 67.74 | 67.74 | 0.05 | 0.05 |
| UNLV | MWC | 0.13 | 0.13 | 60.61 | 60.61 | 0.03 | 0.03 |
| New Mexico | MWC | 0.13 | 0.13 | 54.55 | 54.55 | 0.01 | 0.01 |
| Gonzaga | WCC | 0.13 | 0.13 | 88.24 | 88.24 | 0.10 | 0.10 |
| Northern Arizona | BSky | 0.13 | 0.13 | 13.33 | 13.33 | -0.09 | -0.09 |
| Illinois | B10 | 0.13 | 0.13 | 41.94 | 41.94 | -0.02 | -0.02 |
| Wisconsin | B10 | 0.12 | 0.12 | 45.45 | 45.45 | -0.01 | -0.01 |
| Kansas | B12 | 0.12 | 0.12 | 79.41 | 79.41 | 0.07 | 0.07 |
| Princeton | Ivy | 0.11 | 0.11 | 42.86 | 42.86 | -0.02 | -0.02 |
| Prairie View A&M | SWAC | 0.11 | 0.11 | 45.45 | 45.45 | -0.01 | -0.01 |
| North Dakota | BSky | 0.11 | 0.11 | 33.33 | 33.33 | -0.04 | -0.04 |
| Portland St. | BSky | 0.11 | 0.11 | 56.67 | 56.67 | 0.01 | 0.01 |
| Weber St. | BSky | 0.11 | 0.11 | 60.71 | 60.71 | 0.02 | 0.02 |
| Boise St. | MWC | 0.11 | 0.11 | 73.33 | 73.33 | 0.05 | 0.05 |
| San Jose St. | MWC | 0.11 | 0.11 | 10.34 | 10.34 | -0.08 | -0.08 |
| Arkansas | SEC | 0.10 | 0.10 | 67.65 | 67.65 | 0.04 | 0.04 |
| BYU | WCC | 0.10 | 0.10 | 70.59 | 70.59 | 0.04 | 0.04 |
| Indiana | B10 | 0.10 | 0.10 | 51.61 | 51.61 | 0.00 | 0.00 |
| St. John's | BE | 0.10 | 0.10 | 46.88 | 46.88 | -0.01 | -0.01 |
| Marist | MAAC | 0.10 | 0.10 | 19.35 | 19.35 | -0.06 | -0.06 |
| Rutgers | B10 | 0.10 | 0.10 | 42.42 | 42.42 | -0.02 | -0.02 |
| Kansas St. | B12 | 0.10 | 0.10 | 66.67 | 66.67 | 0.03 | 0.03 |
| Howard | MEAC | 0.09 | 0.09 | 25.81 | 25.81 | -0.04 | -0.04 |
| George Mason | A10 | 0.08 | 0.08 | 48.48 | 48.48 | -0.00 | -0.00 |
| Harvard | Ivy | 0.08 | 0.08 | 56.67 | 56.67 | 0.01 | 0.01 |
| Toledo | MAC | 0.08 | 0.08 | 66.67 | 66.67 | 0.03 | 0.03 |
| Miami OH | MAC | 0.08 | 0.08 | 45.16 | 45.16 | -0.01 | -0.01 |
| Morgan St. | MEAC | 0.08 | 0.08 | 36.67 | 36.67 | -0.02 | -0.02 |
| Oakland | Horz | 0.08 | 0.08 | 57.58 | 57.58 | 0.01 | 0.01 |
| SMU | Amer | 0.08 | 0.08 | 51.52 | 51.52 | 0.00 | 0.00 |
| Radford | BSth | 0.08 | 0.08 | 62.50 | 62.50 | 0.02 | 0.02 |
| North Florida | ASun | 0.08 | 0.08 | 36.67 | 36.67 | -0.02 | -0.02 |
| Kent St. | MAC | 0.08 | 0.08 | 48.48 | 48.48 | -0.00 | -0.00 |
| North Dakota St. | Sum | 0.08 | 0.08 | 41.38 | 41.38 | -0.01 | -0.01 |
| Pittsburgh | ACC | 0.08 | 0.08 | 25.00 | 25.00 | -0.04 | -0.04 |
| Iowa | B10 | 0.08 | 0.08 | 42.42 | 42.42 | -0.01 | -0.01 |
| Kentucky | SEC | 0.08 | 0.08 | 70.59 | 70.59 | 0.03 | 0.03 |
| UCF | Amer | 0.07 | 0.07 | 59.38 | 59.38 | 0.01 | 0.01 |
| New Mexico St. | WAC | 0.07 | 0.07 | 83.33 | 83.33 | 0.05 | 0.05 |
| Minnesota | B10 | 0.07 | 0.07 | 46.88 | 46.88 | -0.00 | -0.00 |
| Penn St. | B10 | 0.07 | 0.07 | 61.76 | 61.76 | 0.02 | 0.02 |
| Maryland | B10 | 0.07 | 0.07 | 58.06 | 58.06 | 0.01 | 0.01 |
| Ohio St. | B10 | 0.07 | 0.07 | 75.00 | 75.00 | 0.04 | 0.04 |
| Iowa St. | B12 | 0.07 | 0.07 | 41.94 | 41.94 | -0.01 | -0.01 |
| Oklahoma St. | B12 | 0.07 | 0.07 | 57.58 | 57.58 | 0.01 | 0.01 |
| Purdue | B10 | 0.07 | 0.07 | 82.35 | 82.35 | 0.05 | 0.05 |
| Denver | Sum | 0.07 | 0.07 | 46.43 | 46.43 | -0.01 | -0.01 |
| Baylor | B12 | 0.07 | 0.07 | 54.84 | 54.84 | 0.01 | 0.01 |
| Texas Tech | B12 | 0.07 | 0.07 | 72.73 | 72.73 | 0.03 | 0.03 |
| Binghamton | AE | 0.06 | 0.06 | 31.03 | 31.03 | -0.02 | -0.02 |
| Davidson | A10 | 0.06 | 0.06 | 65.62 | 65.62 | 0.02 | 0.02 |
| Miami FL | ACC | 0.06 | 0.06 | 70.97 | 70.97 | 0.02 | 0.02 |
| Southeast Missouri St. | OVC | 0.06 | 0.06 | 41.38 | 41.38 | -0.01 | -0.01 |
| Troy | SB | 0.06 | 0.06 | 45.16 | 45.16 | -0.01 | -0.01 |
| Akron | MAC | 0.06 | 0.06 | 41.94 | 41.94 | -0.01 | -0.01 |
| Ball St. | MAC | 0.06 | 0.06 | 58.06 | 58.06 | 0.01 | 0.01 |
| Bethune Cookman | MEAC | 0.06 | 0.06 | 53.33 | 53.33 | 0.00 | 0.00 |
| Bowling Green | MAC | 0.06 | 0.06 | 46.67 | 46.67 | -0.00 | -0.00 |
| College of Charleston | CAA | 0.06 | 0.06 | 77.42 | 77.42 | 0.03 | 0.03 |
| Grand Canyon | WAC | 0.06 | 0.06 | 65.62 | 65.62 | 0.02 | 0.02 |
| Northern Illinois | MAC | 0.06 | 0.06 | 36.67 | 36.67 | -0.01 | -0.01 |
| Seattle | WAC | 0.06 | 0.06 | 56.67 | 56.67 | 0.01 | 0.01 |
| UT Arlington | SB | 0.06 | 0.06 | 60.61 | 60.61 | 0.01 | 0.01 |
| Valparaiso | MVC | 0.06 | 0.06 | 43.33 | 43.33 | -0.01 | -0.01 |
| Western Michigan | MAC | 0.06 | 0.06 | 50.00 | 50.00 | 0.00 | 0.00 |
| Lamar | Slnd | 0.05 | 0.05 | 53.57 | 53.57 | 0.00 | 0.00 |
| Nebraska Omaha | Sum | 0.05 | 0.05 | 24.14 | 24.14 | -0.03 | -0.03 |
| Mississippi | SEC | 0.05 | 0.05 | 37.50 | 37.50 | -0.01 | -0.01 |
| Mississippi St. | SEC | 0.05 | 0.05 | 65.62 | 65.62 | 0.02 | 0.02 |
| Cal St. Bakersfield | WAC | 0.05 | 0.05 | 33.33 | 33.33 | -0.02 | -0.02 |
| Florida | SEC | 0.05 | 0.05 | 62.50 | 62.50 | 0.01 | 0.01 |
| Eastern Kentucky | OVC | 0.05 | 0.05 | 31.03 | 31.03 | -0.02 | -0.02 |
| Jacksonville St. | OVC | 0.05 | 0.05 | 62.50 | 62.50 | 0.01 | 0.01 |
| Saint Louis | A10 | 0.05 | 0.05 | 50.00 | 50.00 | 0.00 | 0.00 |
| Alabama | SEC | 0.05 | 0.05 | 55.88 | 55.88 | 0.01 | 0.01 |
| Northwestern | B10 | 0.05 | 0.05 | 45.16 | 45.16 | -0.00 | -0.00 |
| North Carolina | ACC | 0.05 | 0.05 | 71.43 | 71.43 | 0.02 | 0.02 |
| Rider | MAAC | 0.05 | 0.05 | 70.97 | 70.97 | 0.02 | 0.02 |
| South Dakota St. | Sum | 0.05 | 0.05 | 80.00 | 80.00 | 0.03 | 0.03 |
| UT Rio Grande Valley | WAC | 0.05 | 0.05 | 43.33 | 43.33 | -0.01 | -0.01 |
| Connecticut | Amer | 0.05 | 0.05 | 43.75 | 43.75 | -0.01 | -0.01 |
| Oklahoma | B12 | 0.05 | 0.05 | 58.06 | 58.06 | 0.01 | 0.01 |
| TCU | B12 | 0.05 | 0.05 | 65.62 | 65.62 | 0.01 | 0.01 |
| Texas | B12 | 0.05 | 0.05 | 57.58 | 57.58 | 0.01 | 0.01 |
| Arkansas St. | SB | 0.03 | 0.03 | 30.00 | 30.00 | -0.01 | -0.01 |
| Buffalo | MAC | 0.03 | 0.03 | 75.76 | 75.76 | 0.01 | 0.01 |
| Ohio | MAC | 0.03 | 0.03 | 43.33 | 43.33 | -0.00 | -0.00 |
| South Florida | Amer | 0.03 | 0.03 | 31.25 | 31.25 | -0.01 | -0.01 |
| Syracuse | ACC | 0.03 | 0.03 | 60.61 | 60.61 | 0.01 | 0.01 |
| Evansville | MVC | 0.03 | 0.03 | 50.00 | 50.00 | 0.00 | 0.00 |
| Auburn | SEC | 0.03 | 0.03 | 78.12 | 78.12 | 0.01 | 0.01 |
| Belmont | OVC | 0.03 | 0.03 | 72.73 | 72.73 | 0.01 | 0.01 |
| Florida St. | ACC | 0.03 | 0.03 | 64.52 | 64.52 | 0.01 | 0.01 |
| Green Bay | Horz | 0.03 | 0.03 | 33.33 | 33.33 | -0.01 | -0.01 |
| LSU | SEC | 0.03 | 0.03 | 54.84 | 54.84 | 0.00 | 0.00 |
| Missouri St. | MVC | 0.03 | 0.03 | 53.12 | 53.12 | 0.00 | 0.00 |
| Northwestern St. | Slnd | 0.03 | 0.03 | 8.00 | 8.00 | -0.02 | -0.02 |
| Oral Roberts | Sum | 0.03 | 0.03 | 28.57 | 28.57 | -0.01 | -0.01 |
| South Carolina | SEC | 0.03 | 0.03 | 50.00 | 50.00 | 0.00 | 0.00 |
| Stephen F. Austin | Slnd | 0.03 | 0.03 | 80.00 | 80.00 | 0.02 | 0.02 |
| Tennessee | SEC | 0.03 | 0.03 | 75.76 | 75.76 | 0.01 | 0.01 |
| Texas St. | SB | 0.03 | 0.03 | 41.94 | 41.94 | -0.00 | -0.00 |
| Tulane | Amer | 0.03 | 0.03 | 45.16 | 45.16 | -0.00 | -0.00 |
| Vanderbilt | SEC | 0.03 | 0.03 | 37.50 | 37.50 | -0.01 | -0.01 |
| Wagner | NEC | 0.03 | 0.03 | 70.00 | 70.00 | 0.01 | 0.01 |
| Winthrop | BSth | 0.03 | 0.03 | 57.14 | 57.14 | 0.00 | 0.00 |
| Boston College | ACC | 0.03 | 0.03 | 55.88 | 55.88 | 0.00 | 0.00 |
| Central Arkansas | Slnd | 0.03 | 0.03 | 50.00 | 50.00 | 0.00 | 0.00 |
| Creighton | BE | 0.03 | 0.03 | 64.52 | 64.52 | 0.01 | 0.01 |
| Delaware St. | MEAC | 0.03 | 0.03 | 6.67 | 6.67 | -0.02 | -0.02 |
| Duquesne | A10 | 0.03 | 0.03 | 50.00 | 50.00 | 0.00 | 0.00 |
| Eastern Illinois | OVC | 0.03 | 0.03 | 34.48 | 34.48 | -0.01 | -0.01 |
| North Texas | CUSA | 0.03 | 0.03 | 43.33 | 43.33 | -0.00 | -0.00 |
| St. Francis PA | NEC | 0.03 | 0.03 | 57.14 | 57.14 | 0.00 | 0.00 |
| Stetson | ASun | 0.03 | 0.03 | 28.57 | 28.57 | -0.01 | -0.01 |
| UTSA | CUSA | 0.03 | 0.03 | 53.33 | 53.33 | 0.00 | 0.00 |
| Cleveland St. | Horz | 0.02 | 0.02 | 32.35 | 32.35 | -0.01 | -0.01 |
| DePaul | BE | 0.02 | 0.02 | 35.48 | 35.48 | -0.01 | -0.01 |
| Duke | ACC | 0.02 | 0.02 | 78.79 | 78.79 | 0.01 | 0.01 |
| Houston Baptist | Slnd | 0.02 | 0.02 | 10.71 | 10.71 | -0.02 | -0.02 |
| Northeastern | CAA | 0.02 | 0.02 | 68.75 | 68.75 | 0.01 | 0.01 |
| Notre Dame | ACC | 0.02 | 0.02 | 57.58 | 57.58 | 0.00 | 0.00 |
| Savannah St. | MEAC | 0.02 | 0.02 | 43.33 | 43.33 | -0.00 | -0.00 |
| Stony Brook | AE | 0.02 | 0.02 | 38.71 | 38.71 | -0.01 | -0.01 |
| American | Pat | 0.02 | 0.02 | 20.00 | 20.00 | -0.01 | -0.01 |
| Coppin St. | MEAC | 0.02 | 0.02 | 15.62 | 15.62 | -0.02 | -0.02 |
| Fordham | A10 | 0.02 | 0.02 | 29.03 | 29.03 | -0.01 | -0.01 |
| NJIT | ASun | 0.02 | 0.02 | 42.86 | 42.86 | -0.00 | -0.00 |
| North Carolina St. | ACC | 0.02 | 0.02 | 65.62 | 65.62 | 0.01 | 0.01 |
| UMBC | AE | 0.02 | 0.02 | 67.74 | 67.74 | 0.01 | 0.01 |
| Virginia | ACC | 0.02 | 0.02 | 93.94 | 93.94 | 0.02 | 0.02 |