
 - Blog
| Conference: | NEC |
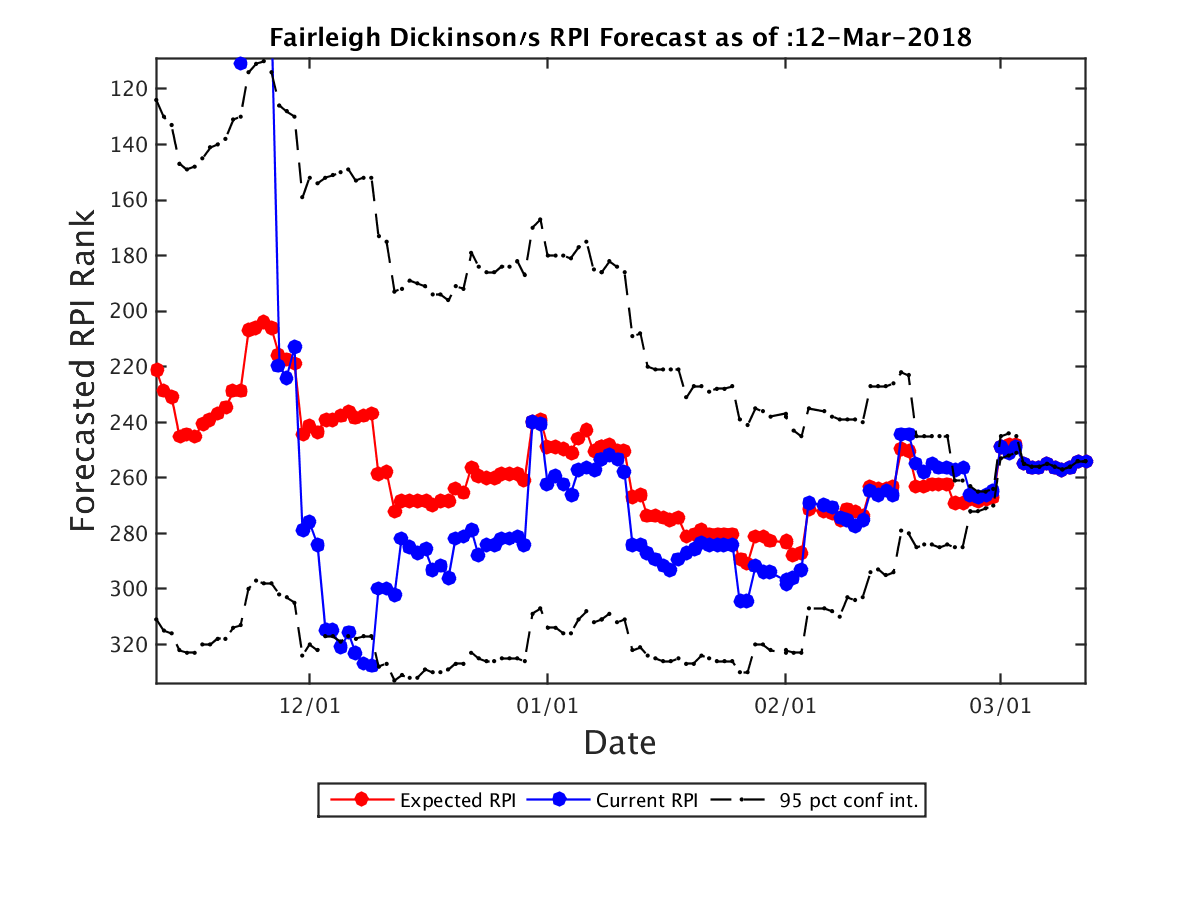
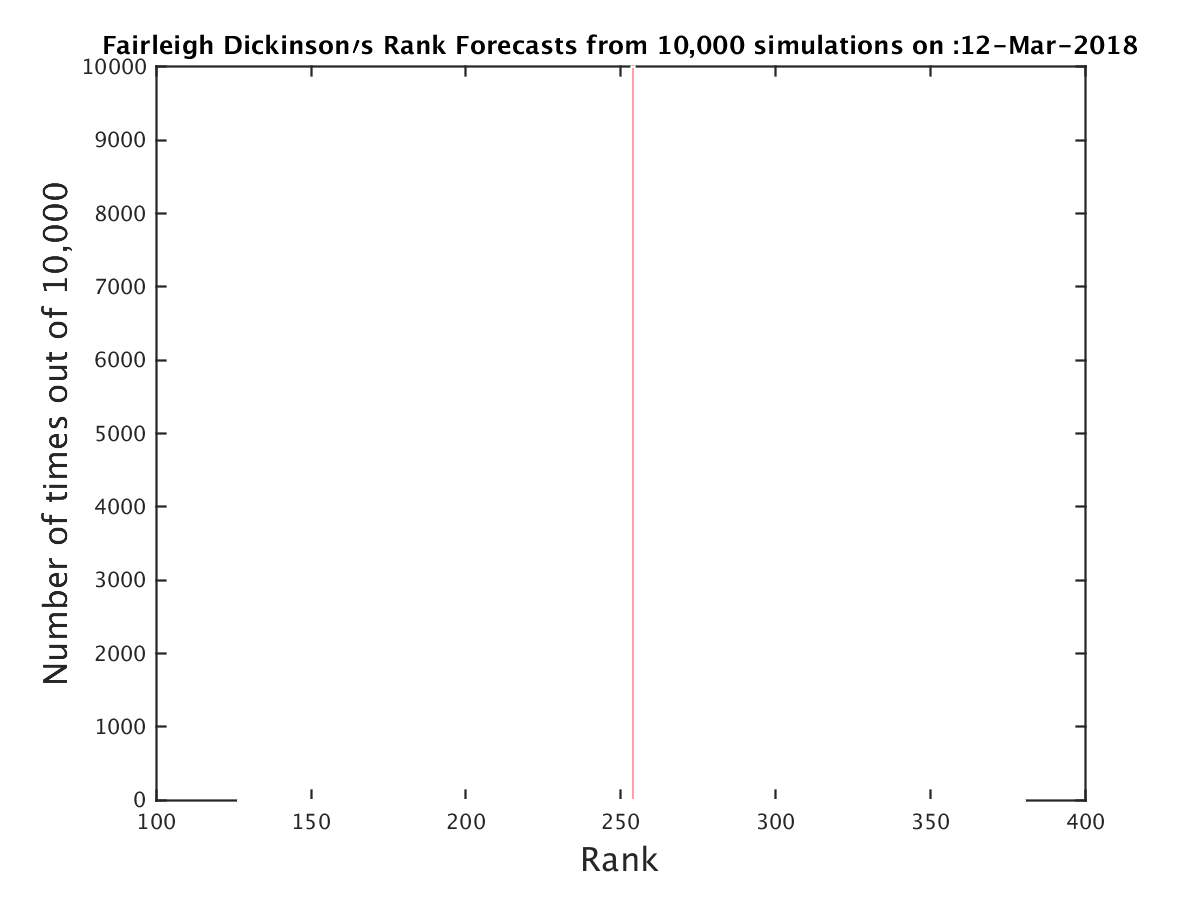
| Expected RPI: | 254.0 |
| Current RPI: | 254 |
| Expected SOS: | 260 |
| Current SOS: | 260 |
| Current Record: | 11-18 |
| Expected Record: | 11-18 |
| Current Conf Record: | 10-10 |
| Expected Conf Record: | 10-10 |
| Expected Record vs RPI 1-25: | 0-0 |
| Expected Record vs RPI 26-50: | 0-1 |
| Expected Record vs RPI 51-100: | 0-2 |
| Expected Record vs RPI 101-200: | 3-5 |
| Expected Record vs RPI 200+: | 8-10 |
| Current OOC Record: | 1-8 |
| Expected OOC Record: | 1-8 |
| Expected OOC RPI: | 322 |
| Expected OOC SOS: | 167 |
| Final Record | Expected RPI | Probability |
|---|---|---|
| 11-18 | 254.0 | 100.00% |
| Date | Opponent (Expected RPI) | Conf | Location | Score | Outcome | Prob(W) | Spread |
|---|---|---|---|---|---|---|---|
| 11-10 | Seton Hall (31.0) | BE | A | 90-68 | L | 0% | 0.0 |
| 11-12 | Penn St. (77.0) | B10 | A | 81-57 | L | 0% | 0.0 |
| 11-22 | Holy Cross (265.0) | Pat | H | 87-76 | W | 100% | 0.0 |
| 11-26 | Princeton (226.0) | Ivy | H | 76-83 | L | 0% | 0.0 |
| 11-29 | Saint Peter's (251.0) | MAAC | A | 77-53 | L | 0% | 0.0 |
| 12-2 | Iona (107.0) | MAAC | A | 82-75 | L | 0% | 0.0 |
| 12-9 | Rutgers (203.0) | B10 | A | 92-54 | L | 0% | 0.0 |
| 12-16 | NJIT (269.0) | ASun | A | 71-68 | L | 0% | 0.0 |
| 12-21 | Maryland (74.0) | B10 | A | 75-50 | L | 0% | 0.0 |
| 12-29 | LIU Brooklyn (232.0) | NEC | A | 71-82 | W | 100% | 0.0 |
| 12-31 | Sacred Heart (321.0) | NEC | A | 66-65 | L | 0% | 0.0 |
| 1-4 | Central Connecticut (263.0) | NEC | H | 81-77 | W | 100% | 0.0 |
| 1-6 | Wagner (109.0) | NEC | A | 73-65 | L | 0% | 0.0 |
| 1-11 | LIU Brooklyn (232.0) | NEC | H | 85-90 | L | 0% | 0.0 |
| 1-13 | Robert Morris (196.0) | NEC | H | 75-81 | L | 0% | 0.0 |
| 1-18 | Central Connecticut (263.0) | NEC | A | 66-65 | L | 0% | 0.0 |
| 1-20 | Mount St. Mary's (225.0) | NEC | H | 73-72 | W | 100% | 0.0 |
| 1-25 | St. Francis NY (276.0) | NEC | H | 70-76 | L | 0% | 0.0 |
| 1-27 | Bryant (341.0) | NEC | A | 78-89 | W | 100% | 0.0 |
| 2-1 | St. Francis PA (178.0) | NEC | A | 74-60 | L | 0% | 0.0 |
| 2-3 | Robert Morris (196.0) | NEC | A | 67-73 | W | 100% | 0.0 |
| 2-8 | Sacred Heart (321.0) | NEC | H | 77-67 | W | 100% | 0.0 |
| 2-11 | Wagner (109.0) | NEC | H | 76-69 | W | 100% | 0.0 |
| 2-15 | Mount St. Mary's (225.0) | NEC | A | 79-80 | W | 100% | 0.0 |
| 2-17 | St. Francis NY (276.0) | NEC | A | 87-74 | L | 0% | 0.0 |
| 2-22 | St. Francis PA (178.0) | NEC | H | 82-90 | L | 0% | 0.0 |
| 2-24 | Bryant (341.0) | NEC | H | 87-83 | W | 100% | 0.0 |
| 2-28 | St. Francis PA (178.0) | NEC | A | 75-84 | W | 100% | 0.0 |
| 3-3 | LIU Brooklyn (232.0) | NEC | A | 78-77 | L | 0% | 0.0 |
| Team | Conf | Curr Wgt | Fut Wgt | Curr W/L | Exp W/L | Curr Impact | Exp Impact |
|---|---|---|---|---|---|---|---|
| Fairleigh Dickinson | NEC | 26.55 | 26.55 | 41.73 | 41.73 | -4.39 | -4.39 |
| LIU Brooklyn | NEC | 6.32 | 6.32 | 50.00 | 50.00 | 0.00 | 0.00 |
| St. Francis PA | NEC | 6.12 | 6.12 | 56.00 | 56.00 | 0.73 | 0.73 |
| Wagner | NEC | 4.70 | 4.70 | 71.43 | 71.43 | 2.02 | 2.02 |
| Robert Morris | NEC | 4.59 | 4.59 | 48.39 | 48.39 | -0.15 | -0.15 |
| St. Francis NY | NEC | 4.56 | 4.56 | 33.33 | 33.33 | -1.52 | -1.52 |
| Central Connecticut | NEC | 4.55 | 4.55 | 43.33 | 43.33 | -0.61 | -0.61 |
| Sacred Heart | NEC | 4.52 | 4.52 | 28.57 | 28.57 | -1.94 | -1.94 |
| Mount St. Mary's | NEC | 4.51 | 4.51 | 57.14 | 57.14 | 0.64 | 0.64 |
| Bryant | NEC | 4.49 | 4.49 | 10.34 | 10.34 | -3.56 | -3.56 |
| Saint Peter's | MAAC | 2.02 | 2.02 | 41.94 | 41.94 | -0.33 | -0.33 |
| Rutgers | B10 | 1.94 | 1.94 | 40.62 | 40.62 | -0.36 | -0.36 |
| NJIT | ASun | 1.94 | 1.94 | 40.74 | 40.74 | -0.36 | -0.36 |
| Seton Hall | BE | 1.87 | 1.87 | 64.52 | 64.52 | 0.54 | 0.54 |
| Iona | MAAC | 1.86 | 1.86 | 59.38 | 59.38 | 0.35 | 0.35 |
| Holy Cross | Pat | 1.81 | 1.81 | 40.00 | 40.00 | -0.36 | -0.36 |
| Penn St. | B10 | 1.81 | 1.81 | 60.61 | 60.61 | 0.38 | 0.38 |
| Maryland | B10 | 1.80 | 1.80 | 56.67 | 56.67 | 0.24 | 0.24 |
| Princeton | Ivy | 1.72 | 1.72 | 40.74 | 40.74 | -0.32 | -0.32 |
| Hartford | AE | 0.41 | 0.41 | 58.06 | 58.06 | 0.07 | 0.07 |
| Brown | Ivy | 0.34 | 0.34 | 38.46 | 38.46 | -0.08 | -0.08 |
| UMass Lowell | AE | 0.28 | 0.28 | 37.93 | 37.93 | -0.07 | -0.07 |
| Rider | MAAC | 0.27 | 0.27 | 70.97 | 70.97 | 0.11 | 0.11 |
| American | Pat | 0.26 | 0.26 | 20.00 | 20.00 | -0.16 | -0.16 |
| Northwestern | B10 | 0.24 | 0.24 | 45.16 | 45.16 | -0.02 | -0.02 |
| Siena | MAAC | 0.24 | 0.24 | 25.00 | 25.00 | -0.12 | -0.12 |
| Fairfield | MAAC | 0.24 | 0.24 | 51.52 | 51.52 | 0.01 | 0.01 |
| Lehigh | Pat | 0.24 | 0.24 | 51.72 | 51.72 | 0.01 | 0.01 |
| Stony Brook | AE | 0.22 | 0.22 | 38.71 | 38.71 | -0.05 | -0.05 |
| Manhattan | MAAC | 0.22 | 0.22 | 45.16 | 45.16 | -0.02 | -0.02 |
| Ohio St. | B10 | 0.21 | 0.21 | 75.00 | 75.00 | 0.10 | 0.10 |
| Lafayette | Pat | 0.20 | 0.20 | 30.00 | 30.00 | -0.08 | -0.08 |
| Navy | Pat | 0.20 | 0.20 | 61.29 | 61.29 | 0.04 | 0.04 |
| Niagara | MAAC | 0.20 | 0.20 | 59.38 | 59.38 | 0.04 | 0.04 |
| St. John's | BE | 0.19 | 0.19 | 46.88 | 46.88 | -0.01 | -0.01 |
| Monmouth | MAAC | 0.19 | 0.19 | 35.48 | 35.48 | -0.06 | -0.06 |
| Purdue | B10 | 0.18 | 0.18 | 82.35 | 82.35 | 0.12 | 0.12 |
| Louisville | ACC | 0.17 | 0.17 | 60.61 | 60.61 | 0.04 | 0.04 |
| Dartmouth | Ivy | 0.17 | 0.17 | 23.08 | 23.08 | -0.09 | -0.09 |
| Fordham | A10 | 0.16 | 0.16 | 29.03 | 29.03 | -0.07 | -0.07 |
| Coppin St. | MEAC | 0.16 | 0.16 | 15.62 | 15.62 | -0.11 | -0.11 |
| Binghamton | AE | 0.16 | 0.16 | 31.03 | 31.03 | -0.06 | -0.06 |
| Canisius | MAAC | 0.16 | 0.16 | 65.62 | 65.62 | 0.05 | 0.05 |
| North Florida | ASun | 0.15 | 0.15 | 36.67 | 36.67 | -0.04 | -0.04 |
| Yale | Ivy | 0.14 | 0.14 | 50.00 | 50.00 | 0.00 | 0.00 |
| Butler | BE | 0.14 | 0.14 | 60.61 | 60.61 | 0.03 | 0.03 |
| Michigan St. | B10 | 0.13 | 0.13 | 87.88 | 87.88 | 0.10 | 0.10 |
| North Carolina St. | ACC | 0.13 | 0.13 | 65.62 | 65.62 | 0.04 | 0.04 |
| Indiana | B10 | 0.13 | 0.13 | 51.61 | 51.61 | 0.00 | 0.00 |
| Nebraska | B10 | 0.13 | 0.13 | 68.75 | 68.75 | 0.05 | 0.05 |
| Florida Gulf Coast | ASun | 0.12 | 0.12 | 64.52 | 64.52 | 0.04 | 0.04 |
| Notre Dame | ACC | 0.12 | 0.12 | 57.58 | 57.58 | 0.02 | 0.02 |
| Army | Pat | 0.12 | 0.12 | 41.38 | 41.38 | -0.02 | -0.02 |
| Colgate | Pat | 0.11 | 0.11 | 58.06 | 58.06 | 0.02 | 0.02 |
| Loyola MD | Pat | 0.11 | 0.11 | 26.67 | 26.67 | -0.05 | -0.05 |
| Duquesne | A10 | 0.11 | 0.11 | 50.00 | 50.00 | 0.00 | 0.00 |
| Ohio | MAC | 0.11 | 0.11 | 43.33 | 43.33 | -0.01 | -0.01 |
| Boston College | ACC | 0.11 | 0.11 | 55.88 | 55.88 | 0.01 | 0.01 |
| Georgetown | BE | 0.11 | 0.11 | 50.00 | 50.00 | 0.00 | 0.00 |
| Maine | AE | 0.11 | 0.11 | 13.33 | 13.33 | -0.08 | -0.08 |
| Marquette | BE | 0.11 | 0.11 | 59.38 | 59.38 | 0.02 | 0.02 |
| Providence | BE | 0.11 | 0.11 | 61.76 | 61.76 | 0.03 | 0.03 |
| Albany | AE | 0.11 | 0.11 | 67.74 | 67.74 | 0.04 | 0.04 |
| DePaul | BE | 0.11 | 0.11 | 35.48 | 35.48 | -0.03 | -0.03 |
| Michigan | B10 | 0.11 | 0.11 | 79.41 | 79.41 | 0.06 | 0.06 |
| Wisconsin | B10 | 0.11 | 0.11 | 45.45 | 45.45 | -0.01 | -0.01 |
| Illinois | B10 | 0.11 | 0.11 | 41.94 | 41.94 | -0.02 | -0.02 |
| Minnesota | B10 | 0.11 | 0.11 | 46.88 | 46.88 | -0.01 | -0.01 |
| Iowa | B10 | 0.10 | 0.10 | 42.42 | 42.42 | -0.02 | -0.02 |
| Duke | ACC | 0.09 | 0.09 | 78.79 | 78.79 | 0.05 | 0.05 |
| Longwood | BSth | 0.09 | 0.09 | 13.33 | 13.33 | -0.07 | -0.07 |
| Saint Mary's | WCC | 0.09 | 0.09 | 84.85 | 84.85 | 0.06 | 0.06 |
| San Francisco | WCC | 0.09 | 0.09 | 53.12 | 53.12 | 0.01 | 0.01 |
| Harvard | Ivy | 0.09 | 0.09 | 56.67 | 56.67 | 0.01 | 0.01 |
| Columbia | Ivy | 0.09 | 0.09 | 26.92 | 26.92 | -0.04 | -0.04 |
| Bucknell | Pat | 0.08 | 0.08 | 73.53 | 73.53 | 0.04 | 0.04 |
| New Hampshire | AE | 0.08 | 0.08 | 27.59 | 27.59 | -0.04 | -0.04 |
| Buffalo | MAC | 0.08 | 0.08 | 75.76 | 75.76 | 0.04 | 0.04 |
| Drexel | CAA | 0.08 | 0.08 | 37.50 | 37.50 | -0.02 | -0.02 |
| Pittsburgh | ACC | 0.08 | 0.08 | 25.00 | 25.00 | -0.04 | -0.04 |
| Rhode Island | A10 | 0.08 | 0.08 | 78.12 | 78.12 | 0.05 | 0.05 |
| Cleveland St. | Horz | 0.08 | 0.08 | 32.35 | 32.35 | -0.03 | -0.03 |
| East Carolina | Amer | 0.08 | 0.08 | 33.33 | 33.33 | -0.03 | -0.03 |
| Marist | MAAC | 0.08 | 0.08 | 19.35 | 19.35 | -0.05 | -0.05 |
| Quinnipiac | MAAC | 0.08 | 0.08 | 36.36 | 36.36 | -0.02 | -0.02 |
| Miami OH | MAC | 0.08 | 0.08 | 45.16 | 45.16 | -0.01 | -0.01 |
| Tulane | Amer | 0.08 | 0.08 | 45.16 | 45.16 | -0.01 | -0.01 |
| Cornell | Ivy | 0.06 | 0.06 | 40.74 | 40.74 | -0.01 | -0.01 |
| Jacksonville | ASun | 0.06 | 0.06 | 37.93 | 37.93 | -0.01 | -0.01 |
| Kennesaw St. | ASun | 0.06 | 0.06 | 28.57 | 28.57 | -0.03 | -0.03 |
| Lipscomb | ASun | 0.06 | 0.06 | 68.97 | 68.97 | 0.02 | 0.02 |
| Penn | Ivy | 0.06 | 0.06 | 74.19 | 74.19 | 0.03 | 0.03 |
| Stetson | ASun | 0.06 | 0.06 | 28.57 | 28.57 | -0.03 | -0.03 |
| USC Upstate | ASun | 0.06 | 0.06 | 10.71 | 10.71 | -0.05 | -0.05 |
| Denver | Sum | 0.06 | 0.06 | 46.43 | 46.43 | -0.00 | -0.00 |
| Dayton | A10 | 0.06 | 0.06 | 45.16 | 45.16 | -0.01 | -0.01 |
| Missouri | SEC | 0.06 | 0.06 | 61.29 | 61.29 | 0.01 | 0.01 |
| Morgan St. | MEAC | 0.06 | 0.06 | 36.67 | 36.67 | -0.02 | -0.02 |
| George Washington | A10 | 0.06 | 0.06 | 45.45 | 45.45 | -0.01 | -0.01 |
| Boston University | Pat | 0.06 | 0.06 | 46.67 | 46.67 | -0.00 | -0.00 |
| Georgia | SEC | 0.06 | 0.06 | 54.55 | 54.55 | 0.01 | 0.01 |
| Memphis | Amer | 0.06 | 0.06 | 61.76 | 61.76 | 0.01 | 0.01 |
| La Salle | A10 | 0.05 | 0.05 | 40.62 | 40.62 | -0.01 | -0.01 |
| Syracuse | ACC | 0.05 | 0.05 | 60.61 | 60.61 | 0.01 | 0.01 |
| Creighton | BE | 0.05 | 0.05 | 64.52 | 64.52 | 0.02 | 0.02 |
| North Carolina A&T | MEAC | 0.05 | 0.05 | 56.25 | 56.25 | 0.01 | 0.01 |
| Northern Illinois | MAC | 0.05 | 0.05 | 36.67 | 36.67 | -0.01 | -0.01 |
| Villanova | BE | 0.05 | 0.05 | 88.24 | 88.24 | 0.04 | 0.04 |
| Xavier | BE | 0.05 | 0.05 | 84.85 | 84.85 | 0.04 | 0.04 |
| Grand Canyon | WAC | 0.05 | 0.05 | 65.62 | 65.62 | 0.02 | 0.02 |
| Little Rock | SB | 0.05 | 0.05 | 20.00 | 20.00 | -0.03 | -0.03 |
| Norfolk St. | MEAC | 0.05 | 0.05 | 43.33 | 43.33 | -0.01 | -0.01 |
| San Diego | WCC | 0.05 | 0.05 | 56.67 | 56.67 | 0.01 | 0.01 |
| Youngstown St. | Horz | 0.05 | 0.05 | 20.00 | 20.00 | -0.03 | -0.03 |
| Akron | MAC | 0.03 | 0.03 | 41.94 | 41.94 | -0.00 | -0.00 |
| BYU | WCC | 0.03 | 0.03 | 70.59 | 70.59 | 0.01 | 0.01 |
| Cal Poly | BW | 0.03 | 0.03 | 24.14 | 24.14 | -0.02 | -0.02 |
| Hawaii | BW | 0.03 | 0.03 | 53.57 | 53.57 | 0.00 | 0.00 |
| Miami FL | ACC | 0.03 | 0.03 | 70.97 | 70.97 | 0.01 | 0.01 |
| Middle Tennessee | CUSA | 0.03 | 0.03 | 76.67 | 76.67 | 0.02 | 0.02 |
| Saint Joseph's | A10 | 0.03 | 0.03 | 50.00 | 50.00 | 0.00 | 0.00 |
| USC | P12 | 0.03 | 0.03 | 67.65 | 67.65 | 0.01 | 0.01 |
| West Virginia | B12 | 0.03 | 0.03 | 70.59 | 70.59 | 0.01 | 0.01 |
| Gardner Webb | BSth | 0.03 | 0.03 | 37.93 | 37.93 | -0.01 | -0.01 |
| Jackson St. | SWAC | 0.03 | 0.03 | 33.33 | 33.33 | -0.01 | -0.01 |
| Maryland Eastern Shore | MEAC | 0.03 | 0.03 | 16.67 | 16.67 | -0.02 | -0.02 |
| Massachusetts | A10 | 0.03 | 0.03 | 39.39 | 39.39 | -0.01 | -0.01 |
| New Mexico | MWC | 0.03 | 0.03 | 54.55 | 54.55 | 0.00 | 0.00 |
| St. Bonaventure | A10 | 0.03 | 0.03 | 78.12 | 78.12 | 0.02 | 0.02 |
| UMBC | AE | 0.03 | 0.03 | 67.74 | 67.74 | 0.01 | 0.01 |
| Elon | CAA | 0.03 | 0.03 | 40.00 | 40.00 | -0.01 | -0.01 |
| Houston Baptist | Slnd | 0.03 | 0.03 | 10.71 | 10.71 | -0.02 | -0.02 |
| South Alabama | SB | 0.03 | 0.03 | 40.00 | 40.00 | -0.01 | -0.01 |
| Texas Tech | B12 | 0.03 | 0.03 | 72.73 | 72.73 | 0.01 | 0.01 |
| Vanderbilt | SEC | 0.03 | 0.03 | 37.50 | 37.50 | -0.01 | -0.01 |
| VCU | A10 | 0.03 | 0.03 | 54.55 | 54.55 | 0.00 | 0.00 |
| Coastal Carolina | SB | 0.03 | 0.03 | 37.93 | 37.93 | -0.01 | -0.01 |
| Florida St. | ACC | 0.03 | 0.03 | 64.52 | 64.52 | 0.01 | 0.01 |
| Northern Kentucky | Horz | 0.03 | 0.03 | 68.97 | 68.97 | 0.01 | 0.01 |
| Weber St. | BSky | 0.03 | 0.03 | 60.71 | 60.71 | 0.01 | 0.01 |
| Campbell | BSth | 0.03 | 0.03 | 46.43 | 46.43 | -0.00 | -0.00 |
| George Mason | A10 | 0.03 | 0.03 | 48.48 | 48.48 | -0.00 | -0.00 |
| Montana | BSky | 0.03 | 0.03 | 77.42 | 77.42 | 0.01 | 0.01 |
| Oral Roberts | Sum | 0.03 | 0.03 | 28.57 | 28.57 | -0.01 | -0.01 |
| Texas A&M | SEC | 0.03 | 0.03 | 62.50 | 62.50 | 0.01 | 0.01 |