
 - Blog
| Conference: | Slnd |
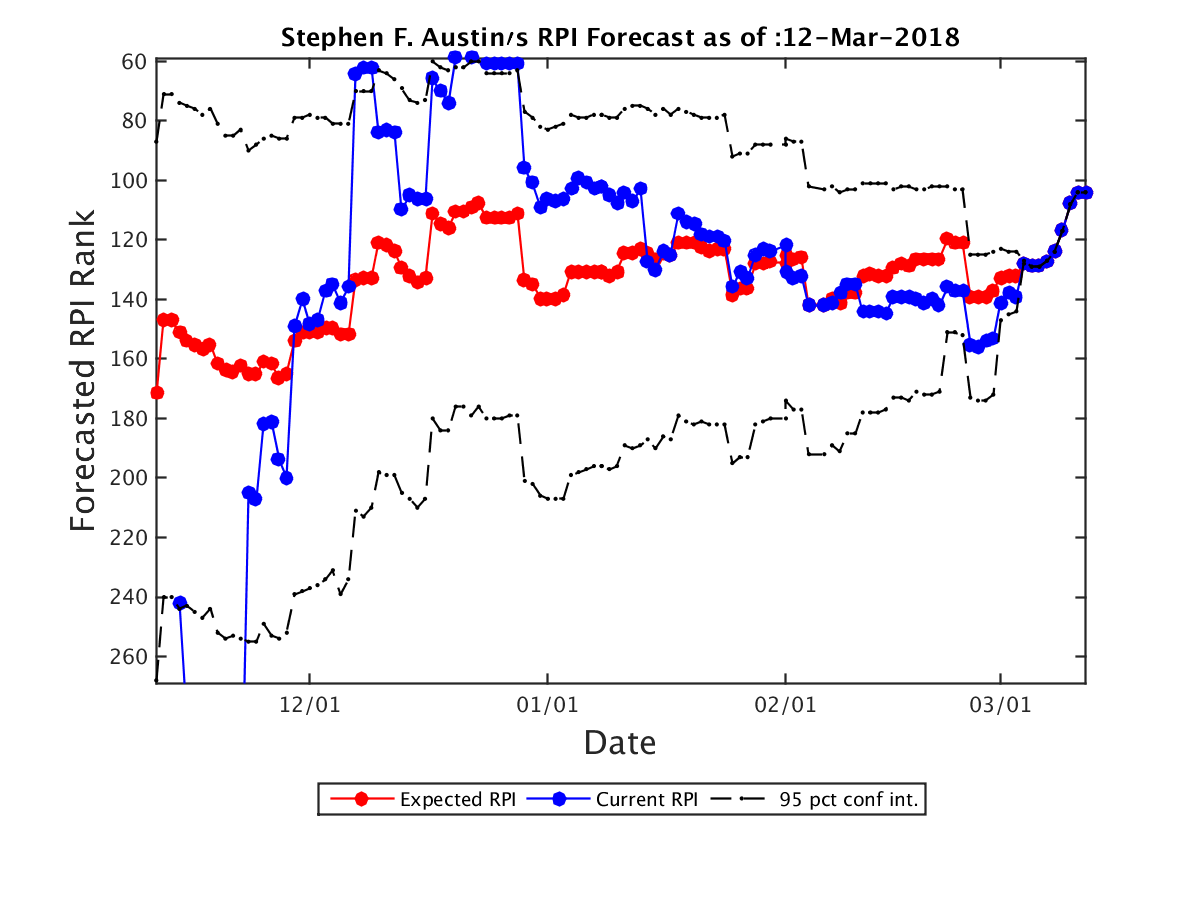
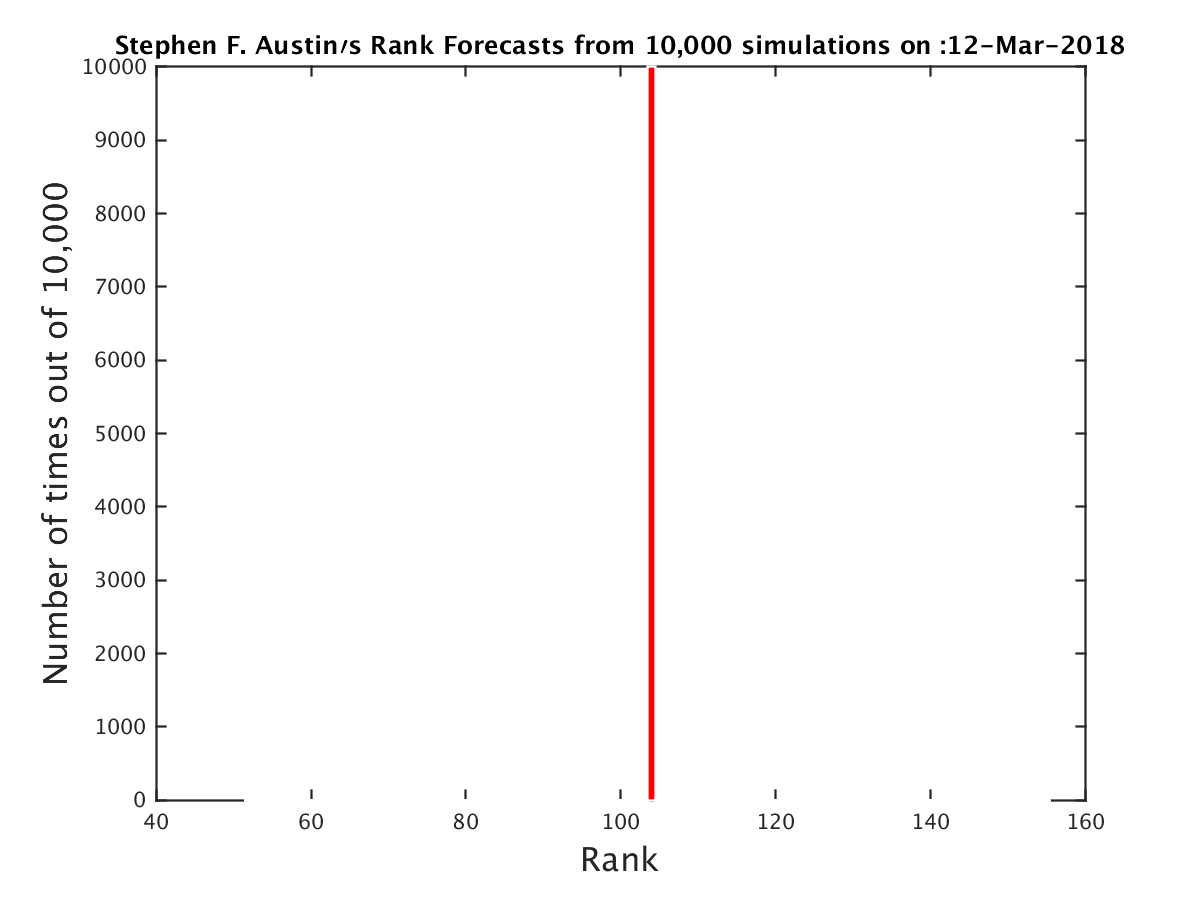
| Expected RPI: | 104.0 |
| Current RPI: | 104 |
| Expected SOS: | 329 |
| Current SOS: | 329 |
| Current Record: | 24-6 |
| Expected Record: | 24-6 |
| Current Conf Record: | 17-4 |
| Expected Conf Record: | 17-4 |
| Expected Record vs RPI 1-25: | 0-0 |
| Expected Record vs RPI 26-50: | 0-1 |
| Expected Record vs RPI 51-100: | 1-1 |
| Expected Record vs RPI 101-200: | 4-1 |
| Expected Record vs RPI 200+: | 19-3 |
| Current OOC Record: | 7-2 |
| Expected OOC Record: | 7-2 |
| Expected OOC RPI: | 92 |
| Expected OOC SOS: | 307 |
| Final Record | Expected RPI | Probability |
|---|---|---|
| 24-6 | 104.0 | 100.00% |
| Date | Opponent (Expected RPI) | Conf | Location | Score | Outcome | Prob(W) | Spread |
|---|---|---|---|---|---|---|---|
| 11-11 | Longwood (337.0) | BSth | A | 61-74 | W | 100% | 0.0 |
| 11-22 | Mississippi St. (73.0) | SEC | A | 80-75 | L | 0% | 0.0 |
| 11-26 | Florida A&M (332.0) | MEAC | H | 79-63 | W | 100% | 0.0 |
| 11-28 | North Dakota St. (210.0) | Sum | H | 54-50 | W | 100% | 0.0 |
| 12-2 | Louisiana Monroe (219.0) | SB | H | 68-65 | W | 100% | 0.0 |
| 12-6 | Louisiana Tech (192.0) | CUSA | A | 83-85 | W | 100% | 0.0 |
| 12-9 | Rice (328.0) | CUSA | H | 81-62 | W | 100% | 0.0 |
| 12-16 | LSU (95.0) | SEC | A | 82-83 | W | 100% | 0.0 |
| 12-19 | Missouri (43.0) | SEC | A | 82-81 | L | 0% | 0.0 |
| 12-28 | Southeastern Louisiana (150.0) | Slnd | A | 73-62 | L | 0% | 0.0 |
| 1-3 | Nicholls St. (145.0) | Slnd | H | 81-64 | W | 100% | 0.0 |
| 1-6 | Northwestern St. (342.0) | Slnd | A | 56-64 | W | 100% | 0.0 |
| 1-10 | New Orleans (239.0) | Slnd | H | 78-68 | W | 100% | 0.0 |
| 1-13 | Incarnate Word (347.0) | Slnd | H | 83-63 | W | 100% | 0.0 |
| 1-17 | Abilene Christian (260.0) | Slnd | A | 66-76 | W | 100% | 0.0 |
| 1-24 | Central Arkansas (223.0) | Slnd | A | 100-92 | L | 0% | 0.0 |
| 1-27 | Sam Houston St. (206.0) | Slnd | H | 82-66 | W | 100% | 0.0 |
| 1-31 | Houston Baptist (345.0) | Slnd | H | 102-82 | W | 100% | 0.0 |
| 2-3 | Lamar (230.0) | Slnd | A | 76-54 | L | 0% | 0.0 |
| 2-8 | McNeese St. (297.0) | Slnd | A | 95-99 | W | 100% | 0.0 |
| 2-10 | Northwestern St. (342.0) | Slnd | H | 97-50 | W | 100% | 0.0 |
| 2-14 | Texas A&M Corpus Chris (326.0) | Slnd | A | 68-87 | W | 100% | 0.0 |
| 2-17 | Incarnate Word (347.0) | Slnd | A | 70-81 | W | 100% | 0.0 |
| 2-21 | Central Arkansas (223.0) | Slnd | H | 97-62 | W | 100% | 0.0 |
| 2-24 | Lamar (230.0) | Slnd | H | 66-71 | L | 0% | 0.0 |
| 2-28 | Abilene Christian (260.0) | Slnd | H | 76-56 | W | 100% | 0.0 |
| 3-3 | Sam Houston St. (206.0) | Slnd | A | 53-65 | W | 100% | 0.0 |
| 3-8 | Central Arkansas (223.0) | Slnd | N | 86-64 | W | 100% | 0.0 |
| 3-9 | Nicholls St. (145.0) | Slnd | N | 66-78 | W | 100% | 0.0 |
| 3-10 | Southeastern Louisiana (150.0) | Slnd | N | 55-59 | W | 100% | 0.0 |
| Team | Conf | Curr Wgt | Fut Wgt | Curr W/L | Exp W/L | Curr Impact | Exp Impact |
|---|---|---|---|---|---|---|---|
| Stephen F. Austin | Slnd | 26.47 | 26.47 | 83.82 | 83.82 | 17.90 | 17.90 |
| Central Arkansas | Slnd | 5.92 | 5.92 | 51.72 | 51.72 | 0.20 | 0.20 |
| Southeastern Louisiana | Slnd | 4.33 | 4.33 | 64.29 | 64.29 | 1.24 | 1.24 |
| Sam Houston St. | Slnd | 4.28 | 4.28 | 55.56 | 55.56 | 0.48 | 0.48 |
| Northwestern St. | Slnd | 4.21 | 4.21 | 8.70 | 8.70 | -3.48 | -3.48 |
| Lamar | Slnd | 4.21 | 4.21 | 50.00 | 50.00 | 0.00 | 0.00 |
| Nicholls St. | Slnd | 4.20 | 4.20 | 65.38 | 65.38 | 1.29 | 1.29 |
| Abilene Christian | Slnd | 4.20 | 4.20 | 48.00 | 48.00 | -0.17 | -0.17 |
| Incarnate Word | Slnd | 4.11 | 4.11 | 13.64 | 13.64 | -2.99 | -2.99 |
| New Orleans | Slnd | 2.68 | 2.68 | 44.44 | 44.44 | -0.30 | -0.30 |
| Texas A&M Corpus Chris | Slnd | 2.61 | 2.61 | 32.00 | 32.00 | -0.94 | -0.94 |
| Houston Baptist | Slnd | 2.58 | 2.58 | 11.11 | 11.11 | -2.01 | -2.01 |
| McNeese St. | Slnd | 2.57 | 2.57 | 33.33 | 33.33 | -0.86 | -0.86 |
| Mississippi St. | SEC | 1.83 | 1.83 | 64.52 | 64.52 | 0.53 | 0.53 |
| LSU | SEC | 1.80 | 1.80 | 56.67 | 56.67 | 0.24 | 0.24 |
| Louisiana Monroe | SB | 1.79 | 1.79 | 48.15 | 48.15 | -0.07 | -0.07 |
| Rice | CUSA | 1.76 | 1.76 | 17.86 | 17.86 | -1.13 | -1.13 |
| Missouri | SEC | 1.75 | 1.75 | 60.00 | 60.00 | 0.35 | 0.35 |
| Florida A&M | MEAC | 1.72 | 1.72 | 25.00 | 25.00 | -0.86 | -0.86 |
| North Dakota St. | Sum | 1.72 | 1.72 | 42.86 | 42.86 | -0.25 | -0.25 |
| Louisiana Tech | CUSA | 1.70 | 1.70 | 50.00 | 50.00 | 0.00 | 0.00 |
| Longwood | BSth | 1.67 | 1.67 | 13.79 | 13.79 | -1.21 | -1.21 |
| Little Rock | SB | 0.30 | 0.30 | 20.00 | 20.00 | -0.18 | -0.18 |
| UTEP | CUSA | 0.27 | 0.27 | 33.33 | 33.33 | -0.09 | -0.09 |
| Louisiana Lafayette | SB | 0.26 | 0.26 | 80.65 | 80.65 | 0.16 | 0.16 |
| Mississippi | SEC | 0.25 | 0.25 | 37.50 | 37.50 | -0.06 | -0.06 |
| Texas St. | SB | 0.21 | 0.21 | 41.94 | 41.94 | -0.03 | -0.03 |
| UTSA | CUSA | 0.17 | 0.17 | 53.33 | 53.33 | 0.01 | 0.01 |
| Baylor | B12 | 0.17 | 0.17 | 54.84 | 54.84 | 0.02 | 0.02 |
| Georgia | SEC | 0.17 | 0.17 | 54.55 | 54.55 | 0.02 | 0.02 |
| Vanderbilt | SEC | 0.16 | 0.16 | 37.50 | 37.50 | -0.04 | -0.04 |
| Alabama | SEC | 0.16 | 0.16 | 55.88 | 55.88 | 0.02 | 0.02 |
| Houston | Amer | 0.16 | 0.16 | 78.79 | 78.79 | 0.09 | 0.09 |
| Morehead St. | OVC | 0.16 | 0.16 | 22.22 | 22.22 | -0.09 | -0.09 |
| UT Rio Grande Valley | WAC | 0.15 | 0.15 | 43.33 | 43.33 | -0.02 | -0.02 |
| Arkansas St. | SB | 0.15 | 0.15 | 30.00 | 30.00 | -0.06 | -0.06 |
| Florida | SEC | 0.15 | 0.15 | 62.50 | 62.50 | 0.04 | 0.04 |
| Coastal Carolina | SB | 0.15 | 0.15 | 37.93 | 37.93 | -0.04 | -0.04 |
| North Texas | CUSA | 0.14 | 0.14 | 43.33 | 43.33 | -0.02 | -0.02 |
| Tulsa | Amer | 0.14 | 0.14 | 61.29 | 61.29 | 0.03 | 0.03 |
| Arkansas | SEC | 0.13 | 0.13 | 67.65 | 67.65 | 0.05 | 0.05 |
| Texas A&M | SEC | 0.13 | 0.13 | 62.50 | 62.50 | 0.03 | 0.03 |
| SMU | Amer | 0.13 | 0.13 | 51.52 | 51.52 | 0.00 | 0.00 |
| Lipscomb | ASun | 0.12 | 0.12 | 68.97 | 68.97 | 0.05 | 0.05 |
| Texas | B12 | 0.12 | 0.12 | 57.58 | 57.58 | 0.02 | 0.02 |
| Campbell | BSth | 0.12 | 0.12 | 46.43 | 46.43 | -0.01 | -0.01 |
| Idaho | BSky | 0.12 | 0.12 | 68.97 | 68.97 | 0.04 | 0.04 |
| Western Kentucky | CUSA | 0.12 | 0.12 | 69.70 | 69.70 | 0.05 | 0.05 |
| Presbyterian | BSth | 0.12 | 0.12 | 27.59 | 27.59 | -0.05 | -0.05 |
| Tulane | Amer | 0.12 | 0.12 | 45.16 | 45.16 | -0.01 | -0.01 |
| Fort Wayne | Sum | 0.11 | 0.11 | 50.00 | 50.00 | 0.00 | 0.00 |
| UAB | CUSA | 0.11 | 0.11 | 58.06 | 58.06 | 0.02 | 0.02 |
| Southern Miss | CUSA | 0.11 | 0.11 | 40.00 | 40.00 | -0.02 | -0.02 |
| Kentucky | SEC | 0.11 | 0.11 | 70.59 | 70.59 | 0.04 | 0.04 |
| South Carolina | SEC | 0.11 | 0.11 | 50.00 | 50.00 | 0.00 | 0.00 |
| Tennessee | SEC | 0.11 | 0.11 | 75.76 | 75.76 | 0.05 | 0.05 |
| North Florida | ASun | 0.11 | 0.11 | 36.67 | 36.67 | -0.03 | -0.03 |
| Alcorn St. | SWAC | 0.11 | 0.11 | 25.00 | 25.00 | -0.05 | -0.05 |
| South Carolina St. | MEAC | 0.10 | 0.10 | 26.67 | 26.67 | -0.05 | -0.05 |
| Loyola Marymount | WCC | 0.10 | 0.10 | 33.33 | 33.33 | -0.03 | -0.03 |
| Utah | P12 | 0.09 | 0.09 | 63.33 | 63.33 | 0.02 | 0.02 |
| Texas Tech | B12 | 0.09 | 0.09 | 72.73 | 72.73 | 0.04 | 0.04 |
| South Alabama | SB | 0.09 | 0.09 | 40.00 | 40.00 | -0.02 | -0.02 |
| UT Arlington | SB | 0.09 | 0.09 | 60.61 | 60.61 | 0.02 | 0.02 |
| South Dakota St. | Sum | 0.09 | 0.09 | 80.00 | 80.00 | 0.05 | 0.05 |
| Grambling St. | SWAC | 0.09 | 0.09 | 53.33 | 53.33 | 0.01 | 0.01 |
| North Carolina A&T | MEAC | 0.08 | 0.08 | 56.25 | 56.25 | 0.01 | 0.01 |
| FIU | CUSA | 0.08 | 0.08 | 37.93 | 37.93 | -0.02 | -0.02 |
| Florida Atlantic | CUSA | 0.08 | 0.08 | 32.14 | 32.14 | -0.03 | -0.03 |
| High Point | BSth | 0.08 | 0.08 | 40.74 | 40.74 | -0.02 | -0.02 |
| Radford | BSth | 0.08 | 0.08 | 62.50 | 62.50 | 0.02 | 0.02 |
| Middle Tennessee | CUSA | 0.08 | 0.08 | 76.67 | 76.67 | 0.04 | 0.04 |
| Old Dominion | CUSA | 0.08 | 0.08 | 78.12 | 78.12 | 0.05 | 0.05 |
| Notre Dame | ACC | 0.08 | 0.08 | 57.58 | 57.58 | 0.01 | 0.01 |
| Samford | SC | 0.08 | 0.08 | 26.67 | 26.67 | -0.04 | -0.04 |
| UCF | Amer | 0.08 | 0.08 | 59.38 | 59.38 | 0.02 | 0.02 |
| Auburn | SEC | 0.08 | 0.08 | 78.12 | 78.12 | 0.04 | 0.04 |
| Green Bay | Horz | 0.08 | 0.08 | 33.33 | 33.33 | -0.03 | -0.03 |
| California | P12 | 0.08 | 0.08 | 25.81 | 25.81 | -0.04 | -0.04 |
| Oregon | P12 | 0.08 | 0.08 | 64.71 | 64.71 | 0.02 | 0.02 |
| San Francisco | WCC | 0.08 | 0.08 | 53.12 | 53.12 | 0.00 | 0.00 |
| UCLA | P12 | 0.08 | 0.08 | 65.62 | 65.62 | 0.02 | 0.02 |
| Howard | MEAC | 0.08 | 0.08 | 25.81 | 25.81 | -0.04 | -0.04 |
| Gonzaga | WCC | 0.07 | 0.07 | 88.24 | 88.24 | 0.05 | 0.05 |
| UMKC | WAC | 0.07 | 0.07 | 27.59 | 27.59 | -0.03 | -0.03 |
| Colorado St. | MWC | 0.07 | 0.07 | 32.26 | 32.26 | -0.02 | -0.02 |
| Oklahoma | B12 | 0.07 | 0.07 | 58.06 | 58.06 | 0.01 | 0.01 |
| Air Force | MWC | 0.06 | 0.06 | 34.48 | 34.48 | -0.02 | -0.02 |
| Bowling Green | MAC | 0.06 | 0.06 | 46.67 | 46.67 | -0.00 | -0.00 |
| USC Upstate | ASun | 0.06 | 0.06 | 10.71 | 10.71 | -0.05 | -0.05 |
| Cal St. Bakersfield | WAC | 0.06 | 0.06 | 33.33 | 33.33 | -0.02 | -0.02 |
| Duquesne | A10 | 0.06 | 0.06 | 50.00 | 50.00 | 0.00 | 0.00 |
| Georgia Southern | SB | 0.06 | 0.06 | 61.29 | 61.29 | 0.01 | 0.01 |
| Seattle | WAC | 0.06 | 0.06 | 56.67 | 56.67 | 0.01 | 0.01 |
| Southern Illinois | MVC | 0.06 | 0.06 | 59.38 | 59.38 | 0.01 | 0.01 |
| Troy | SB | 0.06 | 0.06 | 45.16 | 45.16 | -0.01 | -0.01 |
| UC Davis | BW | 0.06 | 0.06 | 66.67 | 66.67 | 0.02 | 0.02 |
| UMBC | AE | 0.06 | 0.06 | 67.74 | 67.74 | 0.02 | 0.02 |
| Villanova | BE | 0.06 | 0.06 | 88.24 | 88.24 | 0.05 | 0.05 |
| North Carolina Central | MEAC | 0.06 | 0.06 | 51.61 | 51.61 | 0.00 | 0.00 |
| Georgia St. | SB | 0.06 | 0.06 | 68.75 | 68.75 | 0.02 | 0.02 |
| Central Michigan | MAC | 0.06 | 0.06 | 53.33 | 53.33 | 0.00 | 0.00 |
| College of Charleston | CAA | 0.06 | 0.06 | 77.42 | 77.42 | 0.03 | 0.03 |
| Denver | Sum | 0.06 | 0.06 | 46.43 | 46.43 | -0.00 | -0.00 |
| Missouri St. | MVC | 0.06 | 0.06 | 53.12 | 53.12 | 0.00 | 0.00 |
| Nebraska Omaha | Sum | 0.06 | 0.06 | 24.14 | 24.14 | -0.03 | -0.03 |
| North Dakota | BSky | 0.06 | 0.06 | 33.33 | 33.33 | -0.02 | -0.02 |
| Oral Roberts | Sum | 0.06 | 0.06 | 28.57 | 28.57 | -0.02 | -0.02 |
| Santa Clara | WCC | 0.06 | 0.06 | 34.48 | 34.48 | -0.02 | -0.02 |
| South Dakota | Sum | 0.06 | 0.06 | 73.33 | 73.33 | 0.03 | 0.03 |
| Utah Valley | WAC | 0.06 | 0.06 | 65.52 | 65.52 | 0.02 | 0.02 |
| Western Illinois | Sum | 0.06 | 0.06 | 33.33 | 33.33 | -0.02 | -0.02 |
| Jackson St. | SWAC | 0.06 | 0.06 | 33.33 | 33.33 | -0.02 | -0.02 |
| Memphis | Amer | 0.06 | 0.06 | 61.76 | 61.76 | 0.01 | 0.01 |
| St. John's | BE | 0.06 | 0.06 | 46.88 | 46.88 | -0.00 | -0.00 |
| Jacksonville St. | OVC | 0.06 | 0.06 | 62.50 | 62.50 | 0.01 | 0.01 |
| Charlotte | CUSA | 0.06 | 0.06 | 17.86 | 17.86 | -0.04 | -0.04 |
| Marshall | CUSA | 0.06 | 0.06 | 69.70 | 69.70 | 0.02 | 0.02 |
| UNC Wilmington | CAA | 0.06 | 0.06 | 30.00 | 30.00 | -0.02 | -0.02 |
| Charleston Southern | BSth | 0.06 | 0.06 | 42.86 | 42.86 | -0.01 | -0.01 |
| Gardner Webb | BSth | 0.06 | 0.06 | 37.93 | 37.93 | -0.01 | -0.01 |
| Kent St. | MAC | 0.06 | 0.06 | 48.48 | 48.48 | -0.00 | -0.00 |
| Liberty | BSth | 0.06 | 0.06 | 54.84 | 54.84 | 0.01 | 0.01 |
| Mississippi Valley St. | SWAC | 0.06 | 0.06 | 12.50 | 12.50 | -0.04 | -0.04 |
| UNC Asheville | BSth | 0.06 | 0.06 | 61.29 | 61.29 | 0.01 | 0.01 |
| Valparaiso | MVC | 0.06 | 0.06 | 43.33 | 43.33 | -0.01 | -0.01 |
| Winthrop | BSth | 0.06 | 0.06 | 57.14 | 57.14 | 0.01 | 0.01 |
| Illinois | B10 | 0.05 | 0.05 | 41.94 | 41.94 | -0.01 | -0.01 |
| UNLV | MWC | 0.05 | 0.05 | 60.61 | 60.61 | 0.01 | 0.01 |
| Grand Canyon | WAC | 0.05 | 0.05 | 65.62 | 65.62 | 0.02 | 0.02 |
| Alabama St. | SWAC | 0.05 | 0.05 | 25.81 | 25.81 | -0.03 | -0.03 |
| Tennessee Martin | OVC | 0.05 | 0.05 | 27.59 | 27.59 | -0.02 | -0.02 |
| Bethune Cookman | MEAC | 0.05 | 0.05 | 53.33 | 53.33 | 0.00 | 0.00 |
| Delaware St. | MEAC | 0.05 | 0.05 | 6.67 | 6.67 | -0.04 | -0.04 |
| Hampton | MEAC | 0.05 | 0.05 | 51.61 | 51.61 | 0.00 | 0.00 |
| Morgan St. | MEAC | 0.05 | 0.05 | 36.67 | 36.67 | -0.01 | -0.01 |
| Pittsburgh | ACC | 0.03 | 0.03 | 25.00 | 25.00 | -0.02 | -0.02 |
| San Diego St. | MWC | 0.03 | 0.03 | 67.74 | 67.74 | 0.01 | 0.01 |
| Appalachian St. | SB | 0.03 | 0.03 | 41.94 | 41.94 | -0.00 | -0.00 |
| Belmont | OVC | 0.03 | 0.03 | 72.73 | 72.73 | 0.01 | 0.01 |
| Detroit | Horz | 0.03 | 0.03 | 20.00 | 20.00 | -0.02 | -0.02 |
| Michigan St. | B10 | 0.03 | 0.03 | 87.88 | 87.88 | 0.02 | 0.02 |
| Oakland | Horz | 0.03 | 0.03 | 57.58 | 57.58 | 0.00 | 0.00 |
| Oklahoma St. | B12 | 0.03 | 0.03 | 57.58 | 57.58 | 0.00 | 0.00 |
| Providence | BE | 0.03 | 0.03 | 61.76 | 61.76 | 0.01 | 0.01 |
| Saint Peter's | MAAC | 0.03 | 0.03 | 43.75 | 43.75 | -0.00 | -0.00 |
| TCU | B12 | 0.03 | 0.03 | 65.62 | 65.62 | 0.01 | 0.01 |
| Virginia Tech | ACC | 0.03 | 0.03 | 65.62 | 65.62 | 0.01 | 0.01 |
| Arizona | P12 | 0.03 | 0.03 | 79.41 | 79.41 | 0.02 | 0.02 |
| Eastern Kentucky | OVC | 0.03 | 0.03 | 31.03 | 31.03 | -0.01 | -0.01 |
| New Mexico | MWC | 0.03 | 0.03 | 54.55 | 54.55 | 0.00 | 0.00 |
| Stetson | ASun | 0.03 | 0.03 | 28.57 | 28.57 | -0.01 | -0.01 |
| UC Santa Barbara | BW | 0.03 | 0.03 | 70.00 | 70.00 | 0.01 | 0.01 |
| USC | P12 | 0.03 | 0.03 | 67.65 | 67.65 | 0.01 | 0.01 |
| Arizona St. | P12 | 0.03 | 0.03 | 64.52 | 64.52 | 0.01 | 0.01 |
| Columbia | Ivy | 0.03 | 0.03 | 26.92 | 26.92 | -0.01 | -0.01 |
| Cornell | Ivy | 0.03 | 0.03 | 40.74 | 40.74 | -0.01 | -0.01 |
| Delaware | CAA | 0.03 | 0.03 | 38.71 | 38.71 | -0.01 | -0.01 |
| St. Francis PA | NEC | 0.03 | 0.03 | 57.14 | 57.14 | 0.00 | 0.00 |
| UNC Greensboro | SC | 0.03 | 0.03 | 77.42 | 77.42 | 0.02 | 0.02 |
| VMI | SC | 0.03 | 0.03 | 25.00 | 25.00 | -0.01 | -0.01 |
| Evansville | MVC | 0.03 | 0.03 | 50.00 | 50.00 | 0.00 | 0.00 |
| George Mason | A10 | 0.03 | 0.03 | 48.48 | 48.48 | -0.00 | -0.00 |
| Iowa St. | B12 | 0.03 | 0.03 | 41.94 | 41.94 | -0.00 | -0.00 |
| Long Beach St. | BW | 0.03 | 0.03 | 41.94 | 41.94 | -0.00 | -0.00 |
| Marquette | BE | 0.03 | 0.03 | 59.38 | 59.38 | 0.01 | 0.01 |
| Miami OH | MAC | 0.03 | 0.03 | 45.16 | 45.16 | -0.00 | -0.00 |
| Michigan | B10 | 0.03 | 0.03 | 79.41 | 79.41 | 0.02 | 0.02 |
| Montana St. | BSky | 0.03 | 0.03 | 36.67 | 36.67 | -0.01 | -0.01 |
| Southeast Missouri St. | OVC | 0.03 | 0.03 | 41.38 | 41.38 | -0.00 | -0.00 |
| Wagner | NEC | 0.03 | 0.03 | 70.00 | 70.00 | 0.01 | 0.01 |
| West Virginia | B12 | 0.03 | 0.03 | 70.59 | 70.59 | 0.01 | 0.01 |
| Cincinnati | Amer | 0.03 | 0.03 | 88.24 | 88.24 | 0.02 | 0.02 |
| Dayton | A10 | 0.03 | 0.03 | 45.16 | 45.16 | -0.00 | -0.00 |
| Ball St. | MAC | 0.03 | 0.03 | 58.06 | 58.06 | 0.00 | 0.00 |
| Coppin St. | MEAC | 0.03 | 0.03 | 15.62 | 15.62 | -0.02 | -0.02 |
| Fordham | A10 | 0.03 | 0.03 | 29.03 | 29.03 | -0.01 | -0.01 |
| Georgia Tech | ACC | 0.03 | 0.03 | 40.62 | 40.62 | -0.00 | -0.00 |
| Maryland Eastern Shore | MEAC | 0.03 | 0.03 | 16.67 | 16.67 | -0.02 | -0.02 |
| Mercer | SC | 0.03 | 0.03 | 53.33 | 53.33 | 0.00 | 0.00 |
| Miami FL | ACC | 0.03 | 0.03 | 70.97 | 70.97 | 0.01 | 0.01 |
| Murray St. | OVC | 0.03 | 0.03 | 82.76 | 82.76 | 0.02 | 0.02 |
| Norfolk St. | MEAC | 0.03 | 0.03 | 43.33 | 43.33 | -0.00 | -0.00 |
| Savannah St. | MEAC | 0.03 | 0.03 | 43.33 | 43.33 | -0.00 | -0.00 |
| Southern | SWAC | 0.03 | 0.03 | 41.94 | 41.94 | -0.00 | -0.00 |