
 - Blog
| Conference: | BSth |
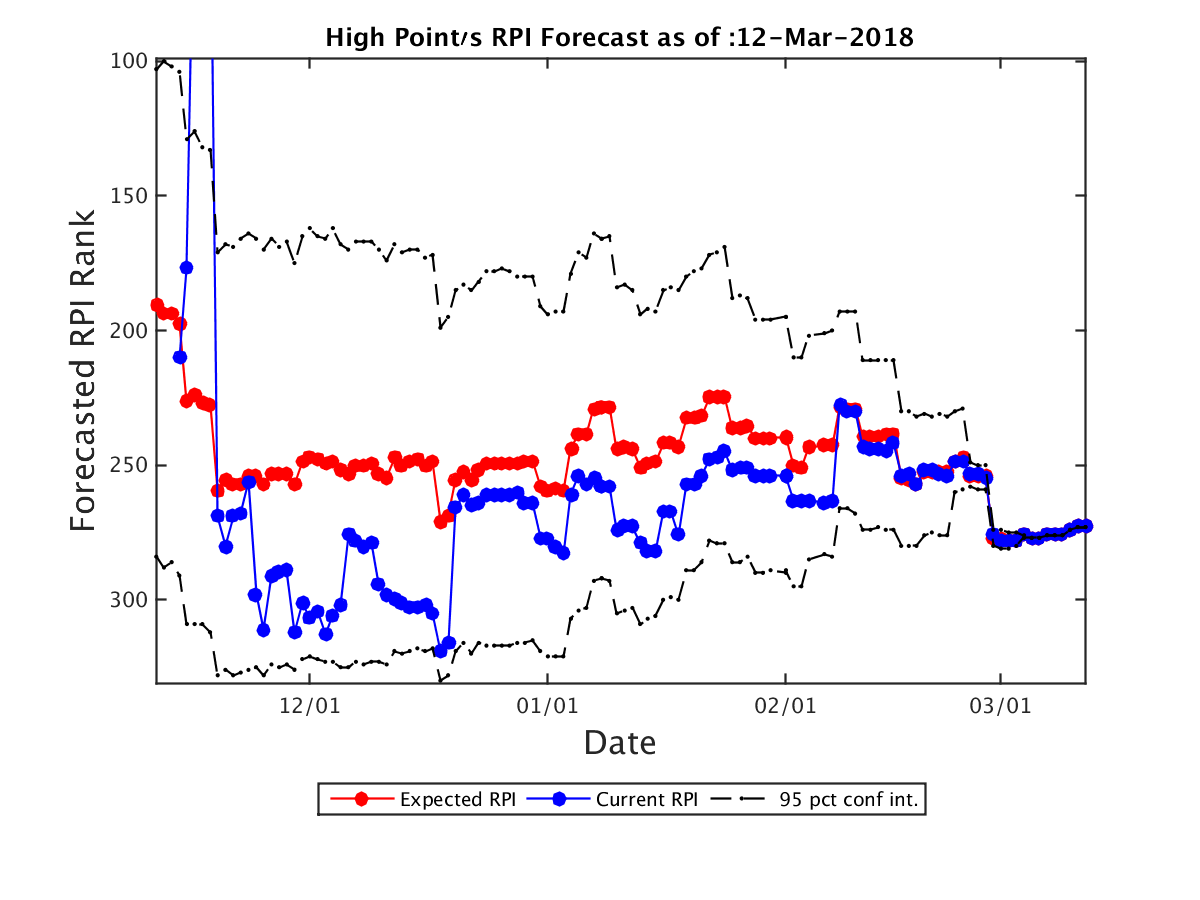
| Expected RPI: | 273.0 |
| Current RPI: | 273 |
| Expected SOS: | 309 |
| Current SOS: | 309 |
| Current Record: | 11-16 |
| Expected Record: | 11-16 |
| Current Conf Record: | 9-10 |
| Expected Conf Record: | 9-10 |
| Expected Record vs RPI 1-25: | 0-1 |
| Expected Record vs RPI 26-50: | 0-0 |
| Expected Record vs RPI 51-100: | 1-1 |
| Expected Record vs RPI 101-200: | 2-5 |
| Expected Record vs RPI 200+: | 8-9 |
| Current OOC Record: | 2-6 |
| Expected OOC Record: | 2-6 |
| Expected OOC RPI: | 271 |
| Expected OOC SOS: | 217 |
| Final Record | Expected RPI | Probability |
|---|---|---|
| 11-16 | 273.0 | 100.00% |
| Date | Opponent (Expected RPI) | Conf | Location | Score | Outcome | Prob(W) | Spread |
|---|---|---|---|---|---|---|---|
| 11-10 | William & Mary (94.0) | CAA | H | 100-66 | W | 100% | 0.0 |
| 11-14 | Tennessee (8.0) | SEC | A | 84-53 | L | 0% | 0.0 |
| 11-18 | The Citadel (281.0) | SC | H | 77-79 | L | 0% | 0.0 |
| 11-24 | Charlotte (323.0) | CUSA | A | 70-67 | L | 0% | 0.0 |
| 11-28 | Pittsburgh (217.0) | ACC | A | 71-63 | L | 0% | 0.0 |
| 12-4 | College of Charleston (57.0) | CAA | A | 70-58 | L | 0% | 0.0 |
| 12-17 | Wofford (129.0) | SC | N | 57-70 | L | 0% | 0.0 |
| 12-19 | Western Carolina (215.0) | SC | A | 61-72 | W | 100% | 0.0 |
| 12-30 | Winthrop (173.0) | BSth | A | 76-60 | L | 0% | 0.0 |
| 1-3 | UNC Asheville (130.0) | BSth | H | 84-74 | W | 100% | 0.0 |
| 1-6 | Charleston Southern (261.0) | BSth | H | 80-59 | W | 100% | 0.0 |
| 1-9 | Gardner Webb (244.0) | BSth | A | 62-45 | L | 0% | 0.0 |
| 1-12 | Campbell (267.0) | BSth | A | 65-64 | L | 0% | 0.0 |
| 1-15 | Presbyterian (319.0) | BSth | H | 73-49 | W | 100% | 0.0 |
| 1-18 | Liberty (211.0) | BSth | H | 71-60 | W | 100% | 0.0 |
| 1-21 | Longwood (337.0) | BSth | A | 55-75 | W | 100% | 0.0 |
| 1-24 | Radford (128.0) | BSth | H | 76-78 | L | 0% | 0.0 |
| 1-27 | UNC Asheville (130.0) | BSth | A | 84-77 | L | 0% | 0.0 |
| 2-1 | Charleston Southern (261.0) | BSth | A | 83-74 | L | 0% | 0.0 |
| 2-3 | Campbell (267.0) | BSth | H | 67-56 | W | 100% | 0.0 |
| 2-7 | Radford (128.0) | BSth | A | 60-61 | W | 100% | 0.0 |
| 2-10 | Winthrop (173.0) | BSth | H | 70-82 | L | 0% | 0.0 |
| 2-15 | Presbyterian (319.0) | BSth | A | 69-62 | L | 0% | 0.0 |
| 2-18 | Gardner Webb (244.0) | BSth | H | 66-65 | W | 100% | 0.0 |
| 2-22 | Longwood (337.0) | BSth | H | 75-56 | W | 100% | 0.0 |
| 2-24 | Liberty (211.0) | BSth | A | 65-45 | L | 0% | 0.0 |
| 2-27 | Longwood (337.0) | BSth | H | 55-68 | L | 0% | 0.0 |
| Team | Conf | Curr Wgt | Fut Wgt | Curr W/L | Exp W/L | Curr Impact | Exp Impact |
|---|---|---|---|---|---|---|---|
| High Point | BSth | 26.53 | 26.53 | 40.54 | 40.54 | -5.02 | -5.02 |
| Longwood | BSth | 6.62 | 6.62 | 11.11 | 11.11 | -5.15 | -5.15 |
| Radford | BSth | 5.00 | 5.00 | 63.33 | 63.33 | 1.33 | 1.33 |
| UNC Asheville | BSth | 4.96 | 4.96 | 62.07 | 62.07 | 1.20 | 1.20 |
| Liberty | BSth | 4.96 | 4.96 | 55.17 | 55.17 | 0.51 | 0.51 |
| Presbyterian | BSth | 4.90 | 4.90 | 25.93 | 25.93 | -2.36 | -2.36 |
| Charleston Southern | BSth | 4.89 | 4.89 | 42.31 | 42.31 | -0.75 | -0.75 |
| Winthrop | BSth | 4.89 | 4.89 | 53.85 | 53.85 | 0.38 | 0.38 |
| Campbell | BSth | 4.86 | 4.86 | 46.15 | 46.15 | -0.37 | -0.37 |
| Gardner Webb | BSth | 4.83 | 4.83 | 37.04 | 37.04 | -1.25 | -1.25 |
| Western Carolina | SC | 2.07 | 2.07 | 37.93 | 37.93 | -0.50 | -0.50 |
| The Citadel | SC | 2.04 | 2.04 | 25.00 | 25.00 | -1.02 | -1.02 |
| Wofford | SC | 2.04 | 2.04 | 58.62 | 58.62 | 0.35 | 0.35 |
| College of Charleston | CAA | 2.01 | 2.01 | 76.67 | 76.67 | 1.07 | 1.07 |
| Charlotte | CUSA | 1.95 | 1.95 | 14.81 | 14.81 | -1.37 | -1.37 |
| William & Mary | CAA | 1.94 | 1.94 | 60.71 | 60.71 | 0.42 | 0.42 |
| Tennessee | SEC | 1.92 | 1.92 | 75.00 | 75.00 | 0.96 | 0.96 |
| Pittsburgh | ACC | 1.85 | 1.85 | 22.58 | 22.58 | -1.02 | -1.02 |
| UNC Greensboro | SC | 0.53 | 0.53 | 77.42 | 77.42 | 0.29 | 0.29 |
| VMI | SC | 0.50 | 0.50 | 25.00 | 25.00 | -0.25 | -0.25 |
| Furman | SC | 0.37 | 0.37 | 67.74 | 67.74 | 0.13 | 0.13 |
| Mercer | SC | 0.31 | 0.31 | 53.33 | 53.33 | 0.02 | 0.02 |
| USC Upstate | ASun | 0.26 | 0.26 | 10.71 | 10.71 | -0.20 | -0.20 |
| James Madison | CAA | 0.25 | 0.25 | 29.03 | 29.03 | -0.10 | -0.10 |
| South Carolina St. | MEAC | 0.23 | 0.23 | 26.67 | 26.67 | -0.11 | -0.11 |
| Chattanooga | SC | 0.22 | 0.22 | 25.81 | 25.81 | -0.11 | -0.11 |
| Delaware | CAA | 0.22 | 0.22 | 38.71 | 38.71 | -0.05 | -0.05 |
| UNC Wilmington | CAA | 0.19 | 0.19 | 30.00 | 30.00 | -0.08 | -0.08 |
| East Tennessee St. | SC | 0.19 | 0.19 | 71.88 | 71.88 | 0.08 | 0.08 |
| Samford | SC | 0.19 | 0.19 | 26.67 | 26.67 | -0.09 | -0.09 |
| North Carolina St. | ACC | 0.19 | 0.19 | 65.62 | 65.62 | 0.06 | 0.06 |
| Towson | CAA | 0.18 | 0.18 | 53.33 | 53.33 | 0.01 | 0.01 |
| Virginia Tech | ACC | 0.18 | 0.18 | 65.62 | 65.62 | 0.06 | 0.06 |
| Elon | CAA | 0.18 | 0.18 | 40.00 | 40.00 | -0.04 | -0.04 |
| Vanderbilt | SEC | 0.17 | 0.17 | 37.50 | 37.50 | -0.04 | -0.04 |
| Auburn | SEC | 0.16 | 0.16 | 78.12 | 78.12 | 0.09 | 0.09 |
| East Carolina | Amer | 0.16 | 0.16 | 33.33 | 33.33 | -0.05 | -0.05 |
| North Carolina A&T | MEAC | 0.15 | 0.15 | 56.25 | 56.25 | 0.02 | 0.02 |
| Drexel | CAA | 0.15 | 0.15 | 37.50 | 37.50 | -0.04 | -0.04 |
| Northeastern | CAA | 0.15 | 0.15 | 68.75 | 68.75 | 0.06 | 0.06 |
| Wake Forest | ACC | 0.15 | 0.15 | 35.48 | 35.48 | -0.04 | -0.04 |
| Florida St. | ACC | 0.13 | 0.13 | 64.52 | 64.52 | 0.04 | 0.04 |
| Alabama St. | SWAC | 0.13 | 0.13 | 25.81 | 25.81 | -0.06 | -0.06 |
| Hofstra | CAA | 0.12 | 0.12 | 60.00 | 60.00 | 0.02 | 0.02 |
| Georgia | SEC | 0.12 | 0.12 | 54.55 | 54.55 | 0.01 | 0.01 |
| Miami FL | ACC | 0.12 | 0.12 | 70.97 | 70.97 | 0.05 | 0.05 |
| Ohio St. | B10 | 0.12 | 0.12 | 75.00 | 75.00 | 0.06 | 0.06 |
| Clemson | ACC | 0.12 | 0.12 | 71.88 | 71.88 | 0.05 | 0.05 |
| North Carolina | ACC | 0.12 | 0.12 | 71.43 | 71.43 | 0.05 | 0.05 |
| Davidson | A10 | 0.10 | 0.10 | 65.62 | 65.62 | 0.03 | 0.03 |
| Marshall | CUSA | 0.10 | 0.10 | 69.70 | 69.70 | 0.04 | 0.04 |
| Old Dominion | CUSA | 0.10 | 0.10 | 78.12 | 78.12 | 0.06 | 0.06 |
| Hampton | MEAC | 0.10 | 0.10 | 51.61 | 51.61 | 0.00 | 0.00 |
| UCF | Amer | 0.10 | 0.10 | 59.38 | 59.38 | 0.02 | 0.02 |
| Penn St. | B10 | 0.10 | 0.10 | 61.76 | 61.76 | 0.02 | 0.02 |
| Arizona St. | P12 | 0.09 | 0.09 | 64.52 | 64.52 | 0.03 | 0.03 |
| Columbia | Ivy | 0.09 | 0.09 | 26.92 | 26.92 | -0.04 | -0.04 |
| Cornell | Ivy | 0.09 | 0.09 | 40.74 | 40.74 | -0.02 | -0.02 |
| Grand Canyon | WAC | 0.09 | 0.09 | 65.62 | 65.62 | 0.03 | 0.03 |
| Illinois | B10 | 0.09 | 0.09 | 41.94 | 41.94 | -0.01 | -0.01 |
| St. Francis PA | NEC | 0.09 | 0.09 | 57.14 | 57.14 | 0.01 | 0.01 |
| Stephen F. Austin | Slnd | 0.09 | 0.09 | 80.00 | 80.00 | 0.06 | 0.06 |
| Florida | SEC | 0.09 | 0.09 | 62.50 | 62.50 | 0.02 | 0.02 |
| Rhode Island | A10 | 0.09 | 0.09 | 78.12 | 78.12 | 0.05 | 0.05 |
| Georgia Tech | ACC | 0.09 | 0.09 | 40.62 | 40.62 | -0.02 | -0.02 |
| South Carolina | SEC | 0.09 | 0.09 | 50.00 | 50.00 | 0.00 | 0.00 |
| Kentucky | SEC | 0.08 | 0.08 | 70.59 | 70.59 | 0.03 | 0.03 |
| Abilene Christian | Slnd | 0.07 | 0.07 | 44.44 | 44.44 | -0.01 | -0.01 |
| Bowling Green | MAC | 0.07 | 0.07 | 46.67 | 46.67 | -0.00 | -0.00 |
| Colorado St. | MWC | 0.07 | 0.07 | 32.26 | 32.26 | -0.02 | -0.02 |
| Eastern Kentucky | OVC | 0.07 | 0.07 | 31.03 | 31.03 | -0.03 | -0.03 |
| FIU | CUSA | 0.07 | 0.07 | 37.93 | 37.93 | -0.02 | -0.02 |
| Florida Atlantic | CUSA | 0.07 | 0.07 | 32.14 | 32.14 | -0.02 | -0.02 |
| Illinois St. | MVC | 0.07 | 0.07 | 53.12 | 53.12 | 0.00 | 0.00 |
| Saint Louis | A10 | 0.07 | 0.07 | 50.00 | 50.00 | 0.00 | 0.00 |
| Southern Illinois | MVC | 0.07 | 0.07 | 59.38 | 59.38 | 0.01 | 0.01 |
| Stetson | ASun | 0.07 | 0.07 | 28.57 | 28.57 | -0.03 | -0.03 |
| VCU | A10 | 0.07 | 0.07 | 54.55 | 54.55 | 0.01 | 0.01 |
| Western Kentucky | CUSA | 0.07 | 0.07 | 69.70 | 69.70 | 0.03 | 0.03 |
| Chicago St. | WAC | 0.06 | 0.06 | 3.33 | 3.33 | -0.06 | -0.06 |
| Fairfield | MAAC | 0.06 | 0.06 | 51.52 | 51.52 | 0.00 | 0.00 |
| Jacksonville | ASun | 0.06 | 0.06 | 37.93 | 37.93 | -0.02 | -0.02 |
| Maryland | B10 | 0.06 | 0.06 | 58.06 | 58.06 | 0.01 | 0.01 |
| Nicholls St. | Slnd | 0.06 | 0.06 | 60.71 | 60.71 | 0.01 | 0.01 |
| Wright St. | Horz | 0.06 | 0.06 | 71.88 | 71.88 | 0.03 | 0.03 |
| Oklahoma St. | B12 | 0.06 | 0.06 | 57.58 | 57.58 | 0.01 | 0.01 |
| Coastal Carolina | SB | 0.06 | 0.06 | 37.93 | 37.93 | -0.01 | -0.01 |
| Austin Peay | OVC | 0.06 | 0.06 | 53.33 | 53.33 | 0.00 | 0.00 |
| Fort Wayne | Sum | 0.06 | 0.06 | 50.00 | 50.00 | 0.00 | 0.00 |
| Georgia St. | SB | 0.06 | 0.06 | 68.75 | 68.75 | 0.02 | 0.02 |
| Houston | Amer | 0.06 | 0.06 | 78.79 | 78.79 | 0.03 | 0.03 |
| Howard | MEAC | 0.06 | 0.06 | 25.81 | 25.81 | -0.03 | -0.03 |
| Maryland Eastern Shore | MEAC | 0.06 | 0.06 | 16.67 | 16.67 | -0.04 | -0.04 |
| Monmouth | MAAC | 0.06 | 0.06 | 35.48 | 35.48 | -0.02 | -0.02 |
| Quinnipiac | MAAC | 0.06 | 0.06 | 36.36 | 36.36 | -0.02 | -0.02 |
| Saint Mary's | WCC | 0.06 | 0.06 | 84.85 | 84.85 | 0.04 | 0.04 |
| Duke | ACC | 0.06 | 0.06 | 78.79 | 78.79 | 0.03 | 0.03 |
| Louisville | ACC | 0.06 | 0.06 | 60.61 | 60.61 | 0.01 | 0.01 |
| Nevada | MWC | 0.06 | 0.06 | 79.41 | 79.41 | 0.03 | 0.03 |
| Notre Dame | ACC | 0.06 | 0.06 | 57.58 | 57.58 | 0.01 | 0.01 |
| San Francisco | WCC | 0.06 | 0.06 | 53.12 | 53.12 | 0.00 | 0.00 |
| Syracuse | ACC | 0.06 | 0.06 | 60.61 | 60.61 | 0.01 | 0.01 |
| UC Davis | BW | 0.06 | 0.06 | 66.67 | 66.67 | 0.02 | 0.02 |
| Arkansas | SEC | 0.06 | 0.06 | 67.65 | 67.65 | 0.02 | 0.02 |
| Mississippi | SEC | 0.06 | 0.06 | 37.50 | 37.50 | -0.01 | -0.01 |
| Mississippi St. | SEC | 0.06 | 0.06 | 65.62 | 65.62 | 0.02 | 0.02 |
| Louisiana Tech | CUSA | 0.03 | 0.03 | 48.39 | 48.39 | -0.00 | -0.00 |
| Middle Tennessee | CUSA | 0.03 | 0.03 | 76.67 | 76.67 | 0.02 | 0.02 |
| North Texas | CUSA | 0.03 | 0.03 | 43.33 | 43.33 | -0.00 | -0.00 |
| Rice | CUSA | 0.03 | 0.03 | 17.24 | 17.24 | -0.02 | -0.02 |
| South Florida | Amer | 0.03 | 0.03 | 31.25 | 31.25 | -0.01 | -0.01 |
| Southern Miss | CUSA | 0.03 | 0.03 | 40.00 | 40.00 | -0.01 | -0.01 |
| UAB | CUSA | 0.03 | 0.03 | 58.06 | 58.06 | 0.01 | 0.01 |
| UTEP | CUSA | 0.03 | 0.03 | 33.33 | 33.33 | -0.01 | -0.01 |
| UTSA | CUSA | 0.03 | 0.03 | 53.33 | 53.33 | 0.00 | 0.00 |
| George Mason | A10 | 0.03 | 0.03 | 48.48 | 48.48 | -0.00 | -0.00 |
| Marist | MAAC | 0.03 | 0.03 | 19.35 | 19.35 | -0.02 | -0.02 |
| Savannah St. | MEAC | 0.03 | 0.03 | 43.33 | 43.33 | -0.00 | -0.00 |
| TCU | B12 | 0.03 | 0.03 | 65.62 | 65.62 | 0.01 | 0.01 |
| UMBC | AE | 0.03 | 0.03 | 67.74 | 67.74 | 0.01 | 0.01 |
| Alabama A&M | SWAC | 0.03 | 0.03 | 9.68 | 9.68 | -0.02 | -0.02 |
| Appalachian St. | SB | 0.03 | 0.03 | 41.94 | 41.94 | -0.00 | -0.00 |
| California | P12 | 0.03 | 0.03 | 25.81 | 25.81 | -0.01 | -0.01 |
| Cincinnati | Amer | 0.03 | 0.03 | 88.24 | 88.24 | 0.02 | 0.02 |
| Harvard | Ivy | 0.03 | 0.03 | 56.67 | 56.67 | 0.00 | 0.00 |
| Massachusetts | A10 | 0.03 | 0.03 | 39.39 | 39.39 | -0.01 | -0.01 |
| Minnesota | B10 | 0.03 | 0.03 | 46.88 | 46.88 | -0.00 | -0.00 |
| North Florida | ASun | 0.03 | 0.03 | 36.67 | 36.67 | -0.01 | -0.01 |
| Texas Tech | B12 | 0.03 | 0.03 | 72.73 | 72.73 | 0.01 | 0.01 |
| UT Arlington | SB | 0.03 | 0.03 | 60.61 | 60.61 | 0.01 | 0.01 |
| Cal Poly | BW | 0.03 | 0.03 | 24.14 | 24.14 | -0.02 | -0.02 |
| Sam Houston St. | Slnd | 0.03 | 0.03 | 51.72 | 51.72 | 0.00 | 0.00 |
| Siena | MAAC | 0.03 | 0.03 | 25.00 | 25.00 | -0.01 | -0.01 |
| Wichita St. | Amer | 0.03 | 0.03 | 78.12 | 78.12 | 0.02 | 0.02 |
| Boston College | ACC | 0.03 | 0.03 | 55.88 | 55.88 | 0.00 | 0.00 |
| Delaware St. | MEAC | 0.03 | 0.03 | 6.67 | 6.67 | -0.03 | -0.03 |
| Duquesne | A10 | 0.03 | 0.03 | 50.00 | 50.00 | 0.00 | 0.00 |
| Lehigh | Pat | 0.03 | 0.03 | 51.72 | 51.72 | 0.00 | 0.00 |
| McNeese St. | Slnd | 0.03 | 0.03 | 32.00 | 32.00 | -0.01 | -0.01 |
| Montana | BSky | 0.03 | 0.03 | 77.42 | 77.42 | 0.02 | 0.02 |
| Mount St. Mary's | NEC | 0.03 | 0.03 | 53.33 | 53.33 | 0.00 | 0.00 |
| Navy | Pat | 0.03 | 0.03 | 61.29 | 61.29 | 0.01 | 0.01 |
| UC Santa Barbara | BW | 0.03 | 0.03 | 70.00 | 70.00 | 0.01 | 0.01 |
| Virginia | ACC | 0.03 | 0.03 | 93.94 | 93.94 | 0.03 | 0.03 |
| West Virginia | B12 | 0.03 | 0.03 | 70.59 | 70.59 | 0.01 | 0.01 |
| Alabama | SEC | 0.03 | 0.03 | 55.88 | 55.88 | 0.00 | 0.00 |
| Iowa St. | B12 | 0.03 | 0.03 | 41.94 | 41.94 | -0.00 | -0.00 |
| Lipscomb | ASun | 0.03 | 0.03 | 68.97 | 68.97 | 0.01 | 0.01 |
| LSU | SEC | 0.03 | 0.03 | 54.84 | 54.84 | 0.00 | 0.00 |
| Missouri | SEC | 0.03 | 0.03 | 61.29 | 61.29 | 0.01 | 0.01 |
| Purdue | B10 | 0.03 | 0.03 | 82.35 | 82.35 | 0.02 | 0.02 |
| Texas A&M | SEC | 0.03 | 0.03 | 62.50 | 62.50 | 0.01 | 0.01 |
| Villanova | BE | 0.03 | 0.03 | 88.24 | 88.24 | 0.02 | 0.02 |