
 - Blog
| Conference: | BW |
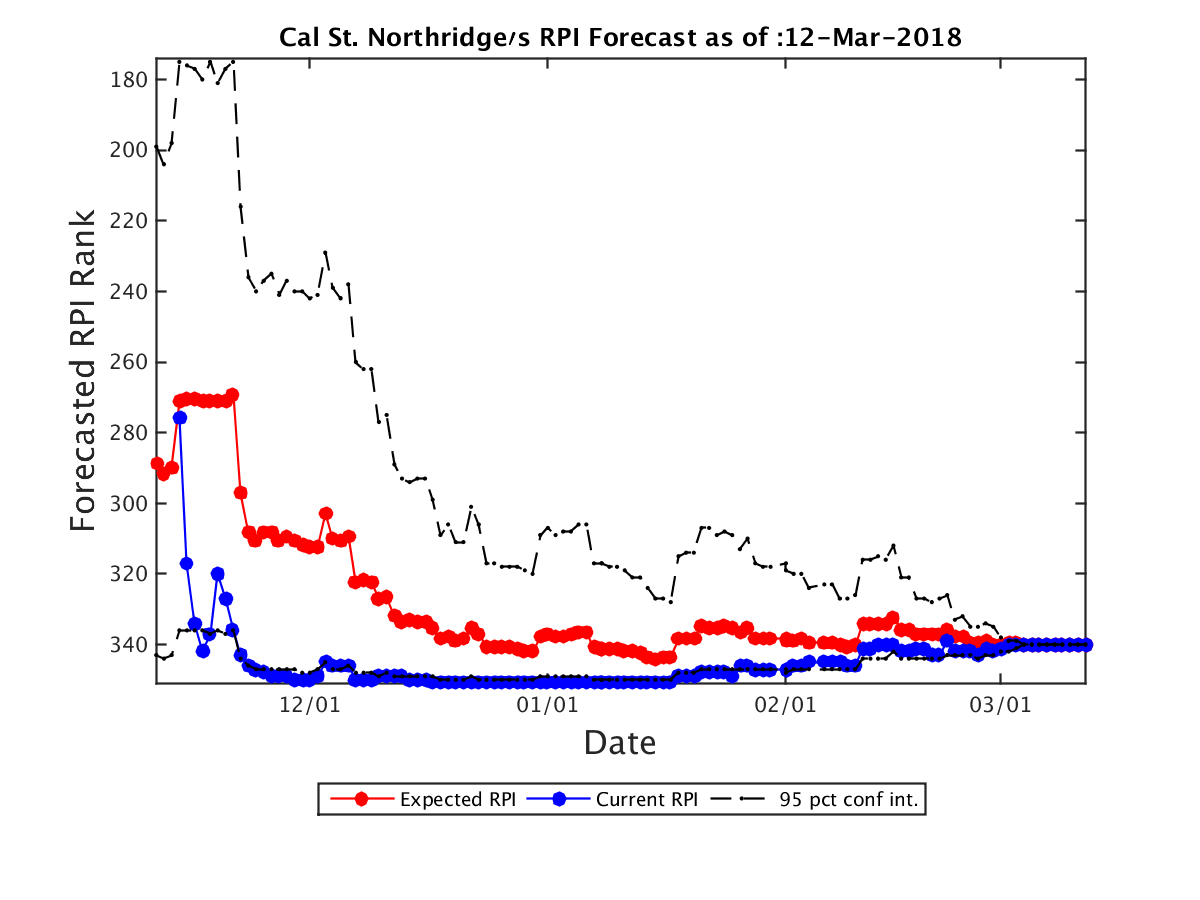
| Expected RPI: | 340.0 |
| Current RPI: | 340 |
| Expected SOS: | 300 |
| Current SOS: | 300 |
| Current Record: | 4-24 |
| Expected Record: | 4-24 |
| Current Conf Record: | 3-13 |
| Expected Conf Record: | 3-13 |
| Expected Record vs RPI 1-25: | 0-0 |
| Expected Record vs RPI 26-50: | 0-0 |
| Expected Record vs RPI 51-100: | 0-1 |
| Expected Record vs RPI 101-200: | 0-12 |
| Expected Record vs RPI 200+: | 4-11 |
| Current OOC Record: | 1-11 |
| Expected OOC Record: | 1-11 |
| Expected OOC RPI: | 351 |
| Expected OOC SOS: | 329 |
| Final Record | Expected RPI | Probability |
|---|---|---|
| 4-24 | 340.0 | 100.00% |
| Date | Opponent (Expected RPI) | Conf | Location | Score | Outcome | Prob(W) | Spread |
|---|---|---|---|---|---|---|---|
| 11-13 | Fresno St. (103.0) | MWC | A | 89-73 | L | 0% | 0.0 |
| 11-18 | George Mason (201.0) | A10 | A | 78-73 | L | 0% | 0.0 |
| 11-21 | Southeast Missouri St. (257.0) | OVC | N | 74-59 | L | 0% | 0.0 |
| 11-22 | Binghamton (320.0) | AE | N | 65-70 | L | 0% | 0.0 |
| 11-28 | California (216.0) | P12 | A | 83-63 | L | 0% | 0.0 |
| 12-3 | Montana (76.0) | BSky | A | 86-68 | L | 0% | 0.0 |
| 12-6 | Idaho St. (268.0) | BSky | A | 74-66 | L | 0% | 0.0 |
| 12-9 | Loyola Marymount (258.0) | WCC | H | 57-74 | L | 0% | 0.0 |
| 12-17 | Eastern Washington (122.0) | BSky | A | 86-58 | L | 0% | 0.0 |
| 12-19 | Sacramento St. (309.0) | BSky | A | 66-61 | L | 0% | 0.0 |
| 12-23 | Idaho St. (268.0) | BSky | H | 55-67 | L | 0% | 0.0 |
| 12-30 | Morgan St. (327.0) | MEAC | H | 79-69 | W | 100% | 0.0 |
| 1-6 | Hawaii (213.0) | BW | H | 46-65 | L | 0% | 0.0 |
| 1-10 | Long Beach St. (191.0) | BW | A | 80-70 | L | 0% | 0.0 |
| 1-13 | UC Irvine (119.0) | BW | H | 54-71 | L | 0% | 0.0 |
| 1-17 | UC Riverside (300.0) | BW | A | 57-66 | W | 100% | 0.0 |
| 1-20 | Cal Poly (305.0) | BW | H | 72-54 | W | 100% | 0.0 |
| 1-25 | UC Davis (102.0) | BW | A | 63-56 | L | 0% | 0.0 |
| 1-27 | Long Beach St. (191.0) | BW | H | 66-70 | L | 0% | 0.0 |
| 2-1 | UC Davis (102.0) | BW | H | 56-63 | L | 0% | 0.0 |
| 2-3 | UC Santa Barbara (127.0) | BW | A | 75-51 | L | 0% | 0.0 |
| 2-7 | UC Irvine (119.0) | BW | A | 77-56 | L | 0% | 0.0 |
| 2-10 | Hawaii (213.0) | BW | A | 71-77 | W | 100% | 0.0 |
| 2-14 | UC Riverside (300.0) | BW | H | 62-69 | L | 0% | 0.0 |
| 2-17 | Cal St. Fullerton (131.0) | BW | A | 88-70 | L | 0% | 0.0 |
| 2-22 | Cal Poly (305.0) | BW | A | 90-86 | L | 0% | 0.0 |
| 2-24 | UC Santa Barbara (127.0) | BW | H | 73-82 | L | 0% | 0.0 |
| 2-28 | Cal St. Fullerton (131.0) | BW | H | 76-102 | L | 0% | 0.0 |
| Team | Conf | Curr Wgt | Fut Wgt | Curr W/L | Exp W/L | Curr Impact | Exp Impact |
|---|---|---|---|---|---|---|---|
| Cal St. Northridge | BW | 26.38 | 26.38 | 15.15 | 15.15 | -18.39 | -18.39 |
| Cal St. Fullerton | BW | 4.67 | 4.67 | 59.26 | 59.26 | 0.86 | 0.86 |
| UC Irvine | BW | 4.64 | 4.64 | 45.16 | 45.16 | -0.45 | -0.45 |
| UC Santa Barbara | BW | 4.59 | 4.59 | 67.86 | 67.86 | 1.64 | 1.64 |
| UC Davis | BW | 4.56 | 4.56 | 64.29 | 64.29 | 1.30 | 1.30 |
| UC Riverside | BW | 4.55 | 4.55 | 22.22 | 22.22 | -2.53 | -2.53 |
| Cal Poly | BW | 4.52 | 4.52 | 22.22 | 22.22 | -2.51 | -2.51 |
| Long Beach St. | BW | 4.51 | 4.51 | 37.93 | 37.93 | -1.09 | -1.09 |
| Hawaii | BW | 4.46 | 4.46 | 53.85 | 53.85 | 0.34 | 0.34 |
| Idaho St. | BSky | 3.69 | 3.69 | 38.46 | 38.46 | -0.85 | -0.85 |
| Sacramento St. | BSky | 2.21 | 2.21 | 13.79 | 13.79 | -1.60 | -1.60 |
| Montana | BSky | 2.14 | 2.14 | 76.67 | 76.67 | 1.14 | 1.14 |
| California | P12 | 1.97 | 1.97 | 23.33 | 23.33 | -1.05 | -1.05 |
| Eastern Washington | BSky | 1.97 | 1.97 | 54.84 | 54.84 | 0.19 | 0.19 |
| Fresno St. | MWC | 1.93 | 1.93 | 62.07 | 62.07 | 0.47 | 0.47 |
| Loyola Marymount | WCC | 1.91 | 1.91 | 31.03 | 31.03 | -0.72 | -0.72 |
| George Mason | A10 | 1.88 | 1.88 | 46.88 | 46.88 | -0.12 | -0.12 |
| Morgan St. | MEAC | 1.84 | 1.84 | 37.93 | 37.93 | -0.44 | -0.44 |
| Binghamton | AE | 1.84 | 1.84 | 28.57 | 28.57 | -0.79 | -0.79 |
| Southeast Missouri St. | OVC | 1.79 | 1.79 | 39.29 | 39.29 | -0.38 | -0.38 |
| Portland St. | BSky | 0.48 | 0.48 | 56.67 | 56.67 | 0.06 | 0.06 |
| Southern Utah | BSky | 0.42 | 0.42 | 36.67 | 36.67 | -0.11 | -0.11 |
| Northern Colorado | BSky | 0.42 | 0.42 | 61.29 | 61.29 | 0.09 | 0.09 |
| Utah Valley | WAC | 0.37 | 0.37 | 65.52 | 65.52 | 0.12 | 0.12 |
| North Dakota | BSky | 0.36 | 0.36 | 33.33 | 33.33 | -0.12 | -0.12 |
| Montana St. | BSky | 0.36 | 0.36 | 36.67 | 36.67 | -0.10 | -0.10 |
| Northern Arizona | BSky | 0.32 | 0.32 | 13.33 | 13.33 | -0.24 | -0.24 |
| Idaho | BSky | 0.32 | 0.32 | 68.97 | 68.97 | 0.12 | 0.12 |
| Pepperdine | WCC | 0.30 | 0.30 | 16.13 | 16.13 | -0.20 | -0.20 |
| San Francisco | WCC | 0.29 | 0.29 | 53.12 | 53.12 | 0.02 | 0.02 |
| Weber St. | BSky | 0.27 | 0.27 | 60.71 | 60.71 | 0.06 | 0.06 |
| Stanford | P12 | 0.26 | 0.26 | 54.55 | 54.55 | 0.02 | 0.02 |
| Pacific | WCC | 0.24 | 0.24 | 41.94 | 41.94 | -0.04 | -0.04 |
| Nevada | MWC | 0.24 | 0.24 | 79.41 | 79.41 | 0.14 | 0.14 |
| Saint Mary's | WCC | 0.23 | 0.23 | 84.85 | 84.85 | 0.16 | 0.16 |
| Washington | P12 | 0.20 | 0.20 | 62.50 | 62.50 | 0.05 | 0.05 |
| Seattle | WAC | 0.18 | 0.18 | 56.67 | 56.67 | 0.02 | 0.02 |
| Washington St. | P12 | 0.18 | 0.18 | 38.71 | 38.71 | -0.04 | -0.04 |
| Portland | WCC | 0.18 | 0.18 | 24.14 | 24.14 | -0.09 | -0.09 |
| USC | P12 | 0.18 | 0.18 | 67.65 | 67.65 | 0.06 | 0.06 |
| Arizona St. | P12 | 0.18 | 0.18 | 64.52 | 64.52 | 0.05 | 0.05 |
| Oregon St. | P12 | 0.17 | 0.17 | 50.00 | 50.00 | 0.00 | 0.00 |
| North Carolina Central | MEAC | 0.15 | 0.15 | 51.61 | 51.61 | 0.00 | 0.00 |
| San Diego St. | MWC | 0.15 | 0.15 | 67.74 | 67.74 | 0.05 | 0.05 |
| Colorado St. | MWC | 0.15 | 0.15 | 32.26 | 32.26 | -0.05 | -0.05 |
| Princeton | Ivy | 0.13 | 0.13 | 42.86 | 42.86 | -0.02 | -0.02 |
| BYU | WCC | 0.12 | 0.12 | 70.59 | 70.59 | 0.05 | 0.05 |
| Prairie View A&M | SWAC | 0.12 | 0.12 | 45.45 | 45.45 | -0.01 | -0.01 |
| Air Force | MWC | 0.12 | 0.12 | 34.48 | 34.48 | -0.04 | -0.04 |
| Bethune Cookman | MEAC | 0.12 | 0.12 | 53.33 | 53.33 | 0.01 | 0.01 |
| Santa Clara | WCC | 0.12 | 0.12 | 34.48 | 34.48 | -0.04 | -0.04 |
| Utah | P12 | 0.12 | 0.12 | 63.33 | 63.33 | 0.03 | 0.03 |
| San Diego | WCC | 0.12 | 0.12 | 56.67 | 56.67 | 0.02 | 0.02 |
| Arizona | P12 | 0.12 | 0.12 | 79.41 | 79.41 | 0.07 | 0.07 |
| Utah St. | MWC | 0.11 | 0.11 | 48.48 | 48.48 | -0.00 | -0.00 |
| UCLA | P12 | 0.11 | 0.11 | 65.62 | 65.62 | 0.03 | 0.03 |
| Saint Joseph's | A10 | 0.11 | 0.11 | 50.00 | 50.00 | 0.00 | 0.00 |
| Arkansas Pine Bluff | SWAC | 0.09 | 0.09 | 40.00 | 40.00 | -0.02 | -0.02 |
| Howard | MEAC | 0.09 | 0.09 | 25.81 | 25.81 | -0.05 | -0.05 |
| San Jose St. | MWC | 0.09 | 0.09 | 10.34 | 10.34 | -0.07 | -0.07 |
| Evansville | MVC | 0.09 | 0.09 | 50.00 | 50.00 | 0.00 | 0.00 |
| Grand Canyon | WAC | 0.09 | 0.09 | 65.62 | 65.62 | 0.03 | 0.03 |
| UT Arlington | SB | 0.09 | 0.09 | 60.61 | 60.61 | 0.02 | 0.02 |
| Davidson | A10 | 0.09 | 0.09 | 65.62 | 65.62 | 0.03 | 0.03 |
| Delaware St. | MEAC | 0.09 | 0.09 | 6.67 | 6.67 | -0.08 | -0.08 |
| Eastern Kentucky | OVC | 0.09 | 0.09 | 31.03 | 31.03 | -0.03 | -0.03 |
| Gonzaga | WCC | 0.09 | 0.09 | 88.24 | 88.24 | 0.07 | 0.07 |
| Boise St. | MWC | 0.09 | 0.09 | 73.33 | 73.33 | 0.04 | 0.04 |
| Pittsburgh | ACC | 0.09 | 0.09 | 25.00 | 25.00 | -0.04 | -0.04 |
| UNLV | MWC | 0.09 | 0.09 | 60.61 | 60.61 | 0.02 | 0.02 |
| Wyoming | MWC | 0.09 | 0.09 | 59.38 | 59.38 | 0.02 | 0.02 |
| West Virginia | B12 | 0.09 | 0.09 | 70.59 | 70.59 | 0.04 | 0.04 |
| Penn St. | B10 | 0.09 | 0.09 | 61.76 | 61.76 | 0.02 | 0.02 |
| Kansas St. | B12 | 0.08 | 0.08 | 66.67 | 66.67 | 0.03 | 0.03 |
| George Washington | A10 | 0.08 | 0.08 | 45.45 | 45.45 | -0.01 | -0.01 |
| VCU | A10 | 0.08 | 0.08 | 54.55 | 54.55 | 0.01 | 0.01 |
| Massachusetts | A10 | 0.08 | 0.08 | 39.39 | 39.39 | -0.02 | -0.02 |
| Miami FL | ACC | 0.06 | 0.06 | 70.97 | 70.97 | 0.03 | 0.03 |
| Troy | SB | 0.06 | 0.06 | 45.16 | 45.16 | -0.01 | -0.01 |
| Youngstown St. | Horz | 0.06 | 0.06 | 20.00 | 20.00 | -0.04 | -0.04 |
| Albany | AE | 0.06 | 0.06 | 67.74 | 67.74 | 0.02 | 0.02 |
| Austin Peay | OVC | 0.06 | 0.06 | 53.33 | 53.33 | 0.00 | 0.00 |
| Central Michigan | MAC | 0.06 | 0.06 | 53.33 | 53.33 | 0.00 | 0.00 |
| College of Charleston | CAA | 0.06 | 0.06 | 77.42 | 77.42 | 0.03 | 0.03 |
| Eastern Illinois | OVC | 0.06 | 0.06 | 34.48 | 34.48 | -0.02 | -0.02 |
| Georgia | SEC | 0.06 | 0.06 | 54.55 | 54.55 | 0.01 | 0.01 |
| Hartford | AE | 0.06 | 0.06 | 58.06 | 58.06 | 0.01 | 0.01 |
| Harvard | Ivy | 0.06 | 0.06 | 56.67 | 56.67 | 0.01 | 0.01 |
| Maine | AE | 0.06 | 0.06 | 13.33 | 13.33 | -0.05 | -0.05 |
| Michigan | B10 | 0.06 | 0.06 | 79.41 | 79.41 | 0.04 | 0.04 |
| Morehead St. | OVC | 0.06 | 0.06 | 22.22 | 22.22 | -0.03 | -0.03 |
| Murray St. | OVC | 0.06 | 0.06 | 82.76 | 82.76 | 0.04 | 0.04 |
| New Hampshire | AE | 0.06 | 0.06 | 27.59 | 27.59 | -0.03 | -0.03 |
| SIU Edwardsville | OVC | 0.06 | 0.06 | 30.00 | 30.00 | -0.02 | -0.02 |
| SMU | Amer | 0.06 | 0.06 | 51.52 | 51.52 | 0.00 | 0.00 |
| Stony Brook | AE | 0.06 | 0.06 | 38.71 | 38.71 | -0.01 | -0.01 |
| Tennessee Martin | OVC | 0.06 | 0.06 | 27.59 | 27.59 | -0.03 | -0.03 |
| UMass Lowell | AE | 0.06 | 0.06 | 37.93 | 37.93 | -0.01 | -0.01 |
| UMBC | AE | 0.06 | 0.06 | 67.74 | 67.74 | 0.02 | 0.02 |
| Valparaiso | MVC | 0.06 | 0.06 | 43.33 | 43.33 | -0.01 | -0.01 |
| Vermont | AE | 0.06 | 0.06 | 78.79 | 78.79 | 0.04 | 0.04 |
| Coppin St. | MEAC | 0.06 | 0.06 | 15.62 | 15.62 | -0.04 | -0.04 |
| Florida A&M | MEAC | 0.06 | 0.06 | 24.24 | 24.24 | -0.03 | -0.03 |
| Lamar | Slnd | 0.06 | 0.06 | 53.57 | 53.57 | 0.00 | 0.00 |
| Nebraska Omaha | Sum | 0.06 | 0.06 | 24.14 | 24.14 | -0.03 | -0.03 |
| New Mexico | MWC | 0.06 | 0.06 | 54.55 | 54.55 | 0.01 | 0.01 |
| North Dakota St. | Sum | 0.06 | 0.06 | 41.38 | 41.38 | -0.01 | -0.01 |
| Radford | BSth | 0.06 | 0.06 | 62.50 | 62.50 | 0.01 | 0.01 |
| Savannah St. | MEAC | 0.06 | 0.06 | 43.33 | 43.33 | -0.01 | -0.01 |
| South Carolina St. | MEAC | 0.06 | 0.06 | 26.67 | 26.67 | -0.03 | -0.03 |
| Texas A&M | SEC | 0.06 | 0.06 | 62.50 | 62.50 | 0.01 | 0.01 |
| Oregon | P12 | 0.06 | 0.06 | 64.71 | 64.71 | 0.02 | 0.02 |
| Louisiana Tech | CUSA | 0.06 | 0.06 | 48.39 | 48.39 | -0.00 | -0.00 |
| Saint Louis | A10 | 0.06 | 0.06 | 50.00 | 50.00 | 0.00 | 0.00 |
| Eastern Michigan | MAC | 0.06 | 0.06 | 58.62 | 58.62 | 0.01 | 0.01 |
| Michigan St. | B10 | 0.06 | 0.06 | 87.88 | 87.88 | 0.04 | 0.04 |
| Missouri | SEC | 0.06 | 0.06 | 61.29 | 61.29 | 0.01 | 0.01 |
| Nebraska | B10 | 0.06 | 0.06 | 68.75 | 68.75 | 0.02 | 0.02 |
| Georgia St. | SB | 0.06 | 0.06 | 68.75 | 68.75 | 0.02 | 0.02 |
| Denver | Sum | 0.05 | 0.05 | 46.43 | 46.43 | -0.00 | -0.00 |
| New Mexico St. | WAC | 0.05 | 0.05 | 83.33 | 83.33 | 0.04 | 0.04 |
| Richmond | A10 | 0.05 | 0.05 | 37.50 | 37.50 | -0.01 | -0.01 |
| Rider | MAAC | 0.05 | 0.05 | 70.97 | 70.97 | 0.02 | 0.02 |
| South Dakota St. | Sum | 0.05 | 0.05 | 80.00 | 80.00 | 0.03 | 0.03 |
| UT Rio Grande Valley | WAC | 0.05 | 0.05 | 43.33 | 43.33 | -0.01 | -0.01 |
| Army | Pat | 0.03 | 0.03 | 41.38 | 41.38 | -0.01 | -0.01 |
| Belmont | OVC | 0.03 | 0.03 | 72.73 | 72.73 | 0.01 | 0.01 |
| Bradley | MVC | 0.03 | 0.03 | 59.38 | 59.38 | 0.01 | 0.01 |
| Colgate | Pat | 0.03 | 0.03 | 58.06 | 58.06 | 0.00 | 0.00 |
| Cornell | Ivy | 0.03 | 0.03 | 40.74 | 40.74 | -0.01 | -0.01 |
| Jacksonville St. | OVC | 0.03 | 0.03 | 62.50 | 62.50 | 0.01 | 0.01 |
| LIU Brooklyn | NEC | 0.03 | 0.03 | 51.52 | 51.52 | 0.00 | 0.00 |
| Loyola MD | Pat | 0.03 | 0.03 | 26.67 | 26.67 | -0.01 | -0.01 |
| Sacred Heart | NEC | 0.03 | 0.03 | 30.00 | 30.00 | -0.01 | -0.01 |
| Southern Illinois | MVC | 0.03 | 0.03 | 59.38 | 59.38 | 0.01 | 0.01 |
| Tennessee St. | OVC | 0.03 | 0.03 | 46.43 | 46.43 | -0.00 | -0.00 |
| Tennessee Tech | OVC | 0.03 | 0.03 | 54.84 | 54.84 | 0.00 | 0.00 |
| UMKC | WAC | 0.03 | 0.03 | 27.59 | 27.59 | -0.01 | -0.01 |
| Arkansas | SEC | 0.03 | 0.03 | 67.65 | 67.65 | 0.01 | 0.01 |
| Cal St. Bakersfield | WAC | 0.03 | 0.03 | 33.33 | 33.33 | -0.01 | -0.01 |
| Hampton | MEAC | 0.03 | 0.03 | 51.61 | 51.61 | 0.00 | 0.00 |
| Incarnate Word | Slnd | 0.03 | 0.03 | 12.50 | 12.50 | -0.02 | -0.02 |
| Manhattan | MAAC | 0.03 | 0.03 | 45.16 | 45.16 | -0.00 | -0.00 |
| Maryland Eastern Shore | MEAC | 0.03 | 0.03 | 16.67 | 16.67 | -0.02 | -0.02 |
| McNeese St. | Slnd | 0.03 | 0.03 | 32.00 | 32.00 | -0.01 | -0.01 |
| Mount St. Mary's | NEC | 0.03 | 0.03 | 53.33 | 53.33 | 0.00 | 0.00 |
| Navy | Pat | 0.03 | 0.03 | 61.29 | 61.29 | 0.01 | 0.01 |
| Norfolk St. | MEAC | 0.03 | 0.03 | 43.33 | 43.33 | -0.00 | -0.00 |
| North Carolina A&T | MEAC | 0.03 | 0.03 | 56.25 | 56.25 | 0.00 | 0.00 |
| South Florida | Amer | 0.03 | 0.03 | 31.25 | 31.25 | -0.01 | -0.01 |
| Towson | CAA | 0.03 | 0.03 | 53.33 | 53.33 | 0.00 | 0.00 |
| Central Arkansas | Slnd | 0.03 | 0.03 | 50.00 | 50.00 | 0.00 | 0.00 |
| Colorado | P12 | 0.03 | 0.03 | 53.12 | 53.12 | 0.00 | 0.00 |
| Oral Roberts | Sum | 0.03 | 0.03 | 28.57 | 28.57 | -0.01 | -0.01 |
| Wichita St. | Amer | 0.03 | 0.03 | 78.12 | 78.12 | 0.02 | 0.02 |
| Wofford | SC | 0.03 | 0.03 | 60.00 | 60.00 | 0.01 | 0.01 |
| South Dakota | Sum | 0.03 | 0.03 | 73.33 | 73.33 | 0.01 | 0.01 |
| Auburn | SEC | 0.03 | 0.03 | 78.12 | 78.12 | 0.02 | 0.02 |
| Dayton | A10 | 0.03 | 0.03 | 45.16 | 45.16 | -0.00 | -0.00 |
| Duquesne | A10 | 0.03 | 0.03 | 50.00 | 50.00 | 0.00 | 0.00 |
| Fordham | A10 | 0.03 | 0.03 | 29.03 | 29.03 | -0.01 | -0.01 |
| Georgia Southern | SB | 0.03 | 0.03 | 61.29 | 61.29 | 0.01 | 0.01 |
| James Madison | CAA | 0.03 | 0.03 | 29.03 | 29.03 | -0.01 | -0.01 |
| La Salle | A10 | 0.03 | 0.03 | 40.62 | 40.62 | -0.01 | -0.01 |
| Lafayette | Pat | 0.03 | 0.03 | 30.00 | 30.00 | -0.01 | -0.01 |
| Louisville | ACC | 0.03 | 0.03 | 60.61 | 60.61 | 0.01 | 0.01 |
| Rhode Island | A10 | 0.03 | 0.03 | 78.12 | 78.12 | 0.02 | 0.02 |
| St. Bonaventure | A10 | 0.03 | 0.03 | 78.12 | 78.12 | 0.02 | 0.02 |
| William & Mary | CAA | 0.03 | 0.03 | 58.62 | 58.62 | 0.00 | 0.00 |