
 - Blog
| Conference: | BSky |
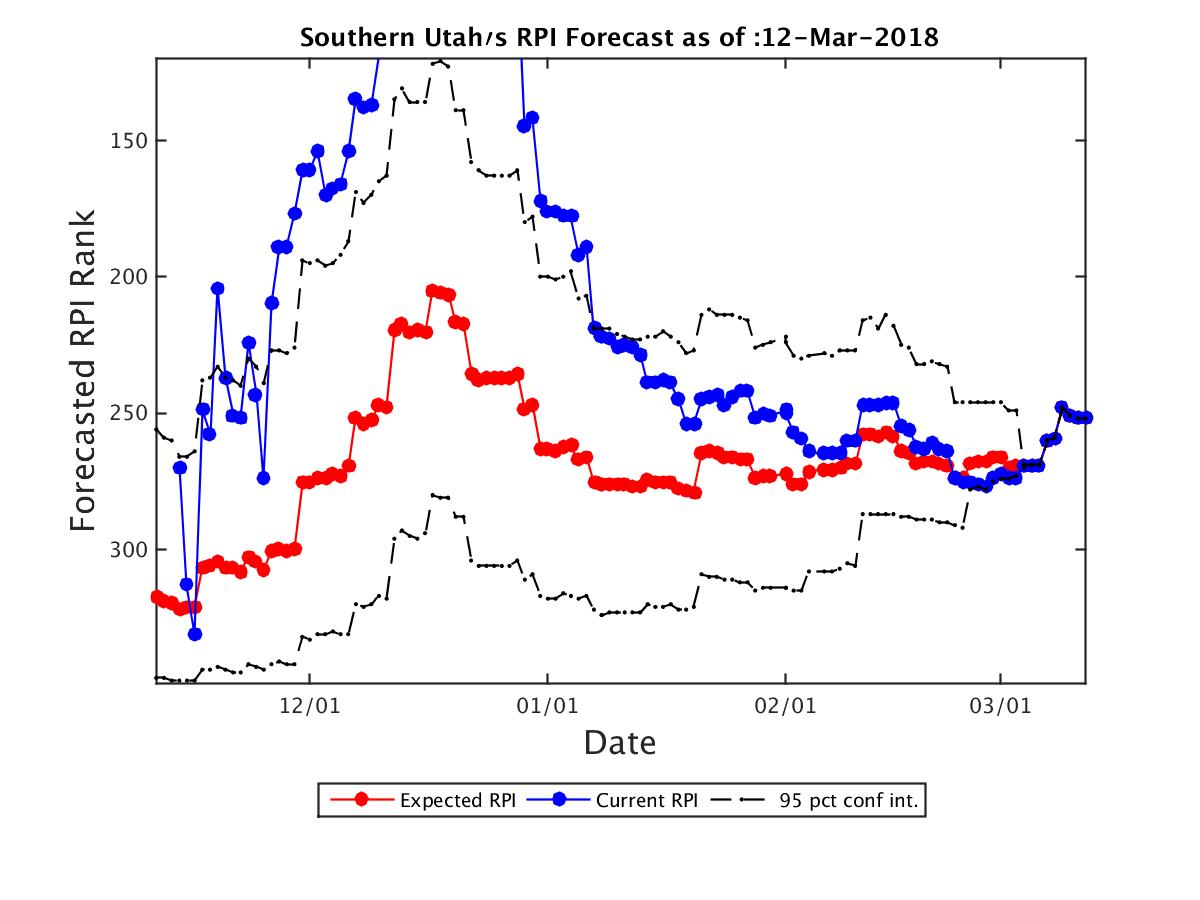
| Expected RPI: | 252.0 |
| Current RPI: | 252 |
| Expected SOS: | 197 |
| Current SOS: | 197 |
| Current Record: | 11-19 |
| Expected Record: | 11-19 |
| Current Conf Record: | 7-14 |
| Expected Conf Record: | 7-14 |
| Expected Record vs RPI 1-25: | 0-1 |
| Expected Record vs RPI 26-50: | 0-1 |
| Expected Record vs RPI 51-100: | 0-2 |
| Expected Record vs RPI 101-200: | 4-11 |
| Expected Record vs RPI 200+: | 7-4 |
| Current OOC Record: | 4-5 |
| Expected OOC Record: | 4-5 |
| Expected OOC RPI: | 169 |
| Expected OOC SOS: | 188 |
| Final Record | Expected RPI | Probability |
|---|---|---|
| 11-19 | 252.0 | 100.00% |
| Date | Opponent (Expected RPI) | Conf | Location | Score | Outcome | Prob(W) | Spread |
|---|---|---|---|---|---|---|---|
| 11-10 | Oregon St. (137.0) | P12 | A | 99-82 | L | 0% | 0.0 |
| 11-12 | Boise St. (50.0) | MWC | A | 90-69 | L | 0% | 0.0 |
| 11-16 | San Jose St. (314.0) | MWC | H | 81-69 | W | 100% | 0.0 |
| 11-25 | UNLV (134.0) | MWC | A | 101-82 | L | 0% | 0.0 |
| 11-29 | Pepperdine (317.0) | WCC | A | 82-88 | W | 100% | 0.0 |
| 12-6 | Long Beach St. (191.0) | BW | H | 94-89 | W | 100% | 0.0 |
| 12-9 | Michigan St. (14.0) | B10 | A | 88-63 | L | 0% | 0.0 |
| 12-16 | Central Michigan (167.0) | MAC | H | 86-80 | W | 100% | 0.0 |
| 12-19 | Iowa (157.0) | B10 | A | 92-64 | L | 0% | 0.0 |
| 12-28 | Montana St. (283.0) | BSky | H | 99-104 | L | 0% | 0.0 |
| 12-30 | Montana (76.0) | BSky | H | 49-79 | L | 0% | 0.0 |
| 1-4 | Idaho St. (268.0) | BSky | A | 93-78 | L | 0% | 0.0 |
| 1-6 | Weber St. (162.0) | BSky | A | 92-76 | L | 0% | 0.0 |
| 1-13 | Northern Arizona (310.0) | BSky | H | 81-75 | W | 100% | 0.0 |
| 1-18 | Idaho (133.0) | BSky | H | 76-80 | L | 0% | 0.0 |
| 1-20 | Eastern Washington (122.0) | BSky | H | 66-62 | W | 100% | 0.0 |
| 1-25 | Montana (76.0) | BSky | A | 71-47 | L | 0% | 0.0 |
| 1-27 | Montana St. (283.0) | BSky | A | 69-66 | L | 0% | 0.0 |
| 2-1 | Weber St. (162.0) | BSky | H | 80-90 | L | 0% | 0.0 |
| 2-3 | Idaho St. (268.0) | BSky | H | 84-80 | W | 100% | 0.0 |
| 2-10 | Northern Arizona (310.0) | BSky | A | 54-63 | W | 100% | 0.0 |
| 2-15 | North Dakota (221.0) | BSky | A | 61-57 | L | 0% | 0.0 |
| 2-17 | Northern Colorado (110.0) | BSky | A | 97-80 | L | 0% | 0.0 |
| 2-22 | Portland St. (170.0) | BSky | H | 91-96 | L | 0% | 0.0 |
| 2-24 | Sacramento St. (309.0) | BSky | H | 77-74 | W | 100% | 0.0 |
| 3-1 | Eastern Washington (122.0) | BSky | A | 74-51 | L | 0% | 0.0 |
| 3-3 | Idaho (133.0) | BSky | A | 78-76 | L | 0% | 0.0 |
| 3-6 | Idaho St. (268.0) | BSky | N | 68-76 | W | 100% | 0.0 |
| 3-8 | Idaho (133.0) | BSky | N | 78-92 | W | 100% | 0.0 |
| 3-9 | Eastern Washington (122.0) | BSky | N | 82-70 | L | 0% | 0.0 |
| Team | Conf | Curr Wgt | Fut Wgt | Curr W/L | Exp W/L | Curr Impact | Exp Impact |
|---|---|---|---|---|---|---|---|
| Southern Utah | BSky | 26.56 | 26.56 | 36.29 | 36.29 | -7.28 | -7.28 |
| Eastern Washington | BSky | 5.87 | 5.87 | 55.17 | 55.17 | 0.61 | 0.61 |
| Idaho St. | BSky | 5.75 | 5.75 | 44.00 | 44.00 | -0.69 | -0.69 |
| Idaho | BSky | 5.75 | 5.75 | 69.23 | 69.23 | 2.21 | 2.21 |
| Northern Arizona | BSky | 4.32 | 4.32 | 14.29 | 14.29 | -3.08 | -3.08 |
| Montana | BSky | 4.22 | 4.22 | 75.86 | 75.86 | 2.18 | 2.18 |
| Weber St. | BSky | 4.17 | 4.17 | 57.69 | 57.69 | 0.64 | 0.64 |
| Montana St. | BSky | 4.14 | 4.14 | 32.14 | 32.14 | -1.48 | -1.48 |
| Northern Colorado | BSky | 2.90 | 2.90 | 60.00 | 60.00 | 0.58 | 0.58 |
| North Dakota | BSky | 2.79 | 2.79 | 31.03 | 31.03 | -1.06 | -1.06 |
| Portland St. | BSky | 2.78 | 2.78 | 55.17 | 55.17 | 0.29 | 0.29 |
| Sacramento St. | BSky | 2.73 | 2.73 | 17.24 | 17.24 | -1.79 | -1.79 |
| UNLV | MWC | 1.88 | 1.88 | 59.38 | 59.38 | 0.35 | 0.35 |
| San Jose St. | MWC | 1.83 | 1.83 | 10.71 | 10.71 | -1.44 | -1.44 |
| Pepperdine | WCC | 1.78 | 1.78 | 16.67 | 16.67 | -1.19 | -1.19 |
| Boise St. | MWC | 1.77 | 1.77 | 72.41 | 72.41 | 0.80 | 0.80 |
| Long Beach St. | BW | 1.77 | 1.77 | 43.33 | 43.33 | -0.24 | -0.24 |
| Central Michigan | MAC | 1.72 | 1.72 | 55.17 | 55.17 | 0.18 | 0.18 |
| Oregon St. | P12 | 1.72 | 1.72 | 48.39 | 48.39 | -0.06 | -0.06 |
| Michigan St. | B10 | 1.72 | 1.72 | 87.50 | 87.50 | 1.29 | 1.29 |
| Iowa | B10 | 1.69 | 1.69 | 40.62 | 40.62 | -0.32 | -0.32 |
| Cal St. Northridge | BW | 0.39 | 0.39 | 14.29 | 14.29 | -0.28 | -0.28 |
| Utah St. | MWC | 0.33 | 0.33 | 48.48 | 48.48 | -0.01 | -0.01 |
| Wyoming | MWC | 0.30 | 0.30 | 59.38 | 59.38 | 0.06 | 0.06 |
| Santa Clara | WCC | 0.28 | 0.28 | 34.48 | 34.48 | -0.09 | -0.09 |
| Nevada | MWC | 0.27 | 0.27 | 79.41 | 79.41 | 0.16 | 0.16 |
| Cal St. Bakersfield | WAC | 0.26 | 0.26 | 33.33 | 33.33 | -0.09 | -0.09 |
| UC Irvine | BW | 0.25 | 0.25 | 48.48 | 48.48 | -0.01 | -0.01 |
| Fresno St. | MWC | 0.25 | 0.25 | 63.33 | 63.33 | 0.07 | 0.07 |
| Washington St. | P12 | 0.23 | 0.23 | 38.71 | 38.71 | -0.05 | -0.05 |
| UC Santa Barbara | BW | 0.22 | 0.22 | 70.00 | 70.00 | 0.09 | 0.09 |
| Stanford | P12 | 0.21 | 0.21 | 54.55 | 54.55 | 0.02 | 0.02 |
| Washington | P12 | 0.21 | 0.21 | 62.50 | 62.50 | 0.05 | 0.05 |
| BYU | WCC | 0.20 | 0.20 | 70.59 | 70.59 | 0.08 | 0.08 |
| Arizona St. | P12 | 0.20 | 0.20 | 64.52 | 64.52 | 0.06 | 0.06 |
| Cal Poly | BW | 0.19 | 0.19 | 24.14 | 24.14 | -0.10 | -0.10 |
| Colorado St. | MWC | 0.19 | 0.19 | 32.26 | 32.26 | -0.07 | -0.07 |
| San Diego St. | MWC | 0.19 | 0.19 | 67.74 | 67.74 | 0.07 | 0.07 |
| South Dakota | Sum | 0.19 | 0.19 | 73.33 | 73.33 | 0.09 | 0.09 |
| Air Force | MWC | 0.19 | 0.19 | 34.48 | 34.48 | -0.06 | -0.06 |
| San Francisco | WCC | 0.19 | 0.19 | 53.12 | 53.12 | 0.01 | 0.01 |
| Utah Valley | WAC | 0.18 | 0.18 | 65.52 | 65.52 | 0.05 | 0.05 |
| Seattle | WAC | 0.17 | 0.17 | 56.67 | 56.67 | 0.02 | 0.02 |
| Portland | WCC | 0.17 | 0.17 | 24.14 | 24.14 | -0.09 | -0.09 |
| New Mexico | MWC | 0.16 | 0.16 | 54.55 | 54.55 | 0.01 | 0.01 |
| UC Riverside | BW | 0.16 | 0.16 | 24.14 | 24.14 | -0.08 | -0.08 |
| Arizona | P12 | 0.16 | 0.16 | 79.41 | 79.41 | 0.09 | 0.09 |
| Michigan | B10 | 0.15 | 0.15 | 79.41 | 79.41 | 0.09 | 0.09 |
| Western Michigan | MAC | 0.14 | 0.14 | 50.00 | 50.00 | 0.00 | 0.00 |
| San Diego | WCC | 0.14 | 0.14 | 56.67 | 56.67 | 0.02 | 0.02 |
| Saint Mary's | WCC | 0.14 | 0.14 | 84.85 | 84.85 | 0.10 | 0.10 |
| Loyola Marymount | WCC | 0.14 | 0.14 | 33.33 | 33.33 | -0.05 | -0.05 |
| UC Davis | BW | 0.14 | 0.14 | 66.67 | 66.67 | 0.05 | 0.05 |
| Georgia St. | SB | 0.13 | 0.13 | 68.75 | 68.75 | 0.05 | 0.05 |
| Penn St. | B10 | 0.13 | 0.13 | 61.76 | 61.76 | 0.03 | 0.03 |
| Utah | P12 | 0.13 | 0.13 | 63.33 | 63.33 | 0.03 | 0.03 |
| Illinois | B10 | 0.13 | 0.13 | 41.94 | 41.94 | -0.02 | -0.02 |
| Youngstown St. | Horz | 0.12 | 0.12 | 20.00 | 20.00 | -0.07 | -0.07 |
| Sam Houston St. | Slnd | 0.11 | 0.11 | 51.72 | 51.72 | 0.00 | 0.00 |
| Arkansas Pine Bluff | SWAC | 0.11 | 0.11 | 40.00 | 40.00 | -0.02 | -0.02 |
| Denver | Sum | 0.11 | 0.11 | 46.43 | 46.43 | -0.01 | -0.01 |
| Nebraska Omaha | Sum | 0.11 | 0.11 | 24.14 | 24.14 | -0.06 | -0.06 |
| Cal St. Fullerton | BW | 0.11 | 0.11 | 62.07 | 62.07 | 0.03 | 0.03 |
| Oregon | P12 | 0.11 | 0.11 | 64.71 | 64.71 | 0.03 | 0.03 |
| Oral Roberts | Sum | 0.11 | 0.11 | 28.57 | 28.57 | -0.05 | -0.05 |
| Nebraska | B10 | 0.11 | 0.11 | 68.75 | 68.75 | 0.04 | 0.04 |
| Eastern Kentucky | OVC | 0.10 | 0.10 | 31.03 | 31.03 | -0.04 | -0.04 |
| Indiana | B10 | 0.10 | 0.10 | 51.61 | 51.61 | 0.00 | 0.00 |
| Wisconsin | B10 | 0.10 | 0.10 | 45.45 | 45.45 | -0.01 | -0.01 |
| Nicholls St. | Slnd | 0.09 | 0.09 | 60.71 | 60.71 | 0.02 | 0.02 |
| Bowling Green | MAC | 0.08 | 0.08 | 46.67 | 46.67 | -0.01 | -0.01 |
| Eastern Michigan | MAC | 0.08 | 0.08 | 58.62 | 58.62 | 0.01 | 0.01 |
| Kent St. | MAC | 0.08 | 0.08 | 48.48 | 48.48 | -0.00 | -0.00 |
| Gonzaga | WCC | 0.08 | 0.08 | 88.24 | 88.24 | 0.06 | 0.06 |
| Hawaii | BW | 0.08 | 0.08 | 53.57 | 53.57 | 0.01 | 0.01 |
| Northern Illinois | MAC | 0.08 | 0.08 | 36.67 | 36.67 | -0.02 | -0.02 |
| Pacific | WCC | 0.08 | 0.08 | 41.94 | 41.94 | -0.01 | -0.01 |
| Colorado | P12 | 0.08 | 0.08 | 53.12 | 53.12 | 0.00 | 0.00 |
| USC | P12 | 0.08 | 0.08 | 67.65 | 67.65 | 0.03 | 0.03 |
| Maryland | B10 | 0.08 | 0.08 | 58.06 | 58.06 | 0.01 | 0.01 |
| Minnesota | B10 | 0.08 | 0.08 | 46.88 | 46.88 | -0.00 | -0.00 |
| Ohio St. | B10 | 0.08 | 0.08 | 75.00 | 75.00 | 0.04 | 0.04 |
| Rutgers | B10 | 0.08 | 0.08 | 42.42 | 42.42 | -0.01 | -0.01 |
| Bradley | MVC | 0.06 | 0.06 | 59.38 | 59.38 | 0.01 | 0.01 |
| Iona | MAAC | 0.06 | 0.06 | 60.61 | 60.61 | 0.01 | 0.01 |
| James Madison | CAA | 0.06 | 0.06 | 29.03 | 29.03 | -0.02 | -0.02 |
| Ball St. | MAC | 0.06 | 0.06 | 58.06 | 58.06 | 0.01 | 0.01 |
| Binghamton | AE | 0.06 | 0.06 | 31.03 | 31.03 | -0.02 | -0.02 |
| Buffalo | MAC | 0.06 | 0.06 | 75.76 | 75.76 | 0.03 | 0.03 |
| Hampton | MEAC | 0.06 | 0.06 | 51.61 | 51.61 | 0.00 | 0.00 |
| Jacksonville | ASun | 0.06 | 0.06 | 37.93 | 37.93 | -0.01 | -0.01 |
| Kansas St. | B12 | 0.06 | 0.06 | 66.67 | 66.67 | 0.02 | 0.02 |
| Louisiana Tech | CUSA | 0.06 | 0.06 | 48.39 | 48.39 | -0.00 | -0.00 |
| Milwaukee | Horz | 0.06 | 0.06 | 48.39 | 48.39 | -0.00 | -0.00 |
| North Dakota St. | Sum | 0.06 | 0.06 | 41.38 | 41.38 | -0.01 | -0.01 |
| Ohio | MAC | 0.06 | 0.06 | 43.33 | 43.33 | -0.01 | -0.01 |
| South Florida | Amer | 0.06 | 0.06 | 31.25 | 31.25 | -0.02 | -0.02 |
| Southeast Missouri St. | OVC | 0.06 | 0.06 | 41.38 | 41.38 | -0.01 | -0.01 |
| Toledo | MAC | 0.06 | 0.06 | 66.67 | 66.67 | 0.02 | 0.02 |
| California | P12 | 0.05 | 0.05 | 25.81 | 25.81 | -0.03 | -0.03 |
| Pittsburgh | ACC | 0.05 | 0.05 | 25.00 | 25.00 | -0.03 | -0.03 |
| Duke | ACC | 0.05 | 0.05 | 78.79 | 78.79 | 0.03 | 0.03 |
| Iowa St. | B12 | 0.05 | 0.05 | 41.94 | 41.94 | -0.01 | -0.01 |
| South Dakota St. | Sum | 0.05 | 0.05 | 80.00 | 80.00 | 0.03 | 0.03 |
| UCLA | P12 | 0.05 | 0.05 | 65.62 | 65.62 | 0.02 | 0.02 |
| Northwestern | B10 | 0.05 | 0.05 | 45.16 | 45.16 | -0.00 | -0.00 |
| Purdue | B10 | 0.05 | 0.05 | 82.35 | 82.35 | 0.03 | 0.03 |
| Southern Illinois | MVC | 0.03 | 0.03 | 59.38 | 59.38 | 0.01 | 0.01 |
| Akron | MAC | 0.03 | 0.03 | 41.94 | 41.94 | -0.00 | -0.00 |
| Butler | BE | 0.03 | 0.03 | 60.61 | 60.61 | 0.01 | 0.01 |
| Creighton | BE | 0.03 | 0.03 | 64.52 | 64.52 | 0.01 | 0.01 |
| Grand Canyon | WAC | 0.03 | 0.03 | 65.62 | 65.62 | 0.01 | 0.01 |
| Illinois St. | MVC | 0.03 | 0.03 | 53.12 | 53.12 | 0.00 | 0.00 |
| Jackson St. | SWAC | 0.03 | 0.03 | 33.33 | 33.33 | -0.01 | -0.01 |
| Loyola Chicago | MVC | 0.03 | 0.03 | 84.38 | 84.38 | 0.02 | 0.02 |
| Miami OH | MAC | 0.03 | 0.03 | 45.16 | 45.16 | -0.00 | -0.00 |
| Saint Joseph's | A10 | 0.03 | 0.03 | 50.00 | 50.00 | 0.00 | 0.00 |
| SIU Edwardsville | OVC | 0.03 | 0.03 | 30.00 | 30.00 | -0.01 | -0.01 |
| SMU | Amer | 0.03 | 0.03 | 51.52 | 51.52 | 0.00 | 0.00 |
| Tennessee Tech | OVC | 0.03 | 0.03 | 54.84 | 54.84 | 0.00 | 0.00 |
| Troy | SB | 0.03 | 0.03 | 45.16 | 45.16 | -0.00 | -0.00 |
| UMKC | WAC | 0.03 | 0.03 | 27.59 | 27.59 | -0.01 | -0.01 |
| UTEP | CUSA | 0.03 | 0.03 | 33.33 | 33.33 | -0.01 | -0.01 |
| Belmont | OVC | 0.03 | 0.03 | 72.73 | 72.73 | 0.01 | 0.01 |
| Missouri | SEC | 0.03 | 0.03 | 61.29 | 61.29 | 0.01 | 0.01 |
| Oklahoma St. | B12 | 0.03 | 0.03 | 57.58 | 57.58 | 0.00 | 0.00 |
| Southern Miss | CUSA | 0.03 | 0.03 | 40.00 | 40.00 | -0.01 | -0.01 |
| Texas A&M | SEC | 0.03 | 0.03 | 62.50 | 62.50 | 0.01 | 0.01 |
| West Virginia | B12 | 0.03 | 0.03 | 70.59 | 70.59 | 0.01 | 0.01 |
| Jacksonville St. | OVC | 0.03 | 0.03 | 62.50 | 62.50 | 0.01 | 0.01 |
| Marist | MAAC | 0.03 | 0.03 | 19.35 | 19.35 | -0.02 | -0.02 |
| Saint Louis | A10 | 0.03 | 0.03 | 50.00 | 50.00 | 0.00 | 0.00 |
| St. John's | BE | 0.03 | 0.03 | 46.88 | 46.88 | -0.00 | -0.00 |
| Alabama St. | SWAC | 0.03 | 0.03 | 25.81 | 25.81 | -0.01 | -0.01 |
| Chicago St. | WAC | 0.03 | 0.03 | 3.33 | 3.33 | -0.02 | -0.02 |
| Cleveland St. | Horz | 0.03 | 0.03 | 32.35 | 32.35 | -0.01 | -0.01 |
| Connecticut | Amer | 0.03 | 0.03 | 43.75 | 43.75 | -0.00 | -0.00 |
| DePaul | BE | 0.03 | 0.03 | 35.48 | 35.48 | -0.01 | -0.01 |
| Drake | MVC | 0.03 | 0.03 | 48.39 | 48.39 | -0.00 | -0.00 |
| Florida A&M | MEAC | 0.03 | 0.03 | 24.24 | 24.24 | -0.01 | -0.01 |
| Grambling St. | SWAC | 0.03 | 0.03 | 53.33 | 53.33 | 0.00 | 0.00 |
| Houston Baptist | Slnd | 0.03 | 0.03 | 10.71 | 10.71 | -0.02 | -0.02 |
| Louisiana Lafayette | SB | 0.03 | 0.03 | 80.65 | 80.65 | 0.02 | 0.02 |
| Mississippi Valley St. | SWAC | 0.03 | 0.03 | 12.50 | 12.50 | -0.02 | -0.02 |
| North Carolina | ACC | 0.03 | 0.03 | 71.43 | 71.43 | 0.01 | 0.01 |
| North Florida | ASun | 0.03 | 0.03 | 36.67 | 36.67 | -0.01 | -0.01 |
| Northern Iowa | MVC | 0.03 | 0.03 | 46.67 | 46.67 | -0.00 | -0.00 |
| Notre Dame | ACC | 0.03 | 0.03 | 57.58 | 57.58 | 0.00 | 0.00 |
| Oakland | Horz | 0.03 | 0.03 | 57.58 | 57.58 | 0.00 | 0.00 |
| Prairie View A&M | SWAC | 0.03 | 0.03 | 45.45 | 45.45 | -0.00 | -0.00 |
| Rice | CUSA | 0.03 | 0.03 | 17.24 | 17.24 | -0.02 | -0.02 |
| Savannah St. | MEAC | 0.03 | 0.03 | 43.33 | 43.33 | -0.00 | -0.00 |
| Southern | SWAC | 0.03 | 0.03 | 41.94 | 41.94 | -0.00 | -0.00 |
| Stony Brook | AE | 0.03 | 0.03 | 38.71 | 38.71 | -0.01 | -0.01 |
| UAB | CUSA | 0.03 | 0.03 | 58.06 | 58.06 | 0.00 | 0.00 |
| Virginia Tech | ACC | 0.03 | 0.03 | 65.62 | 65.62 | 0.01 | 0.01 |