
 - Blog
| Conference: | Sum |
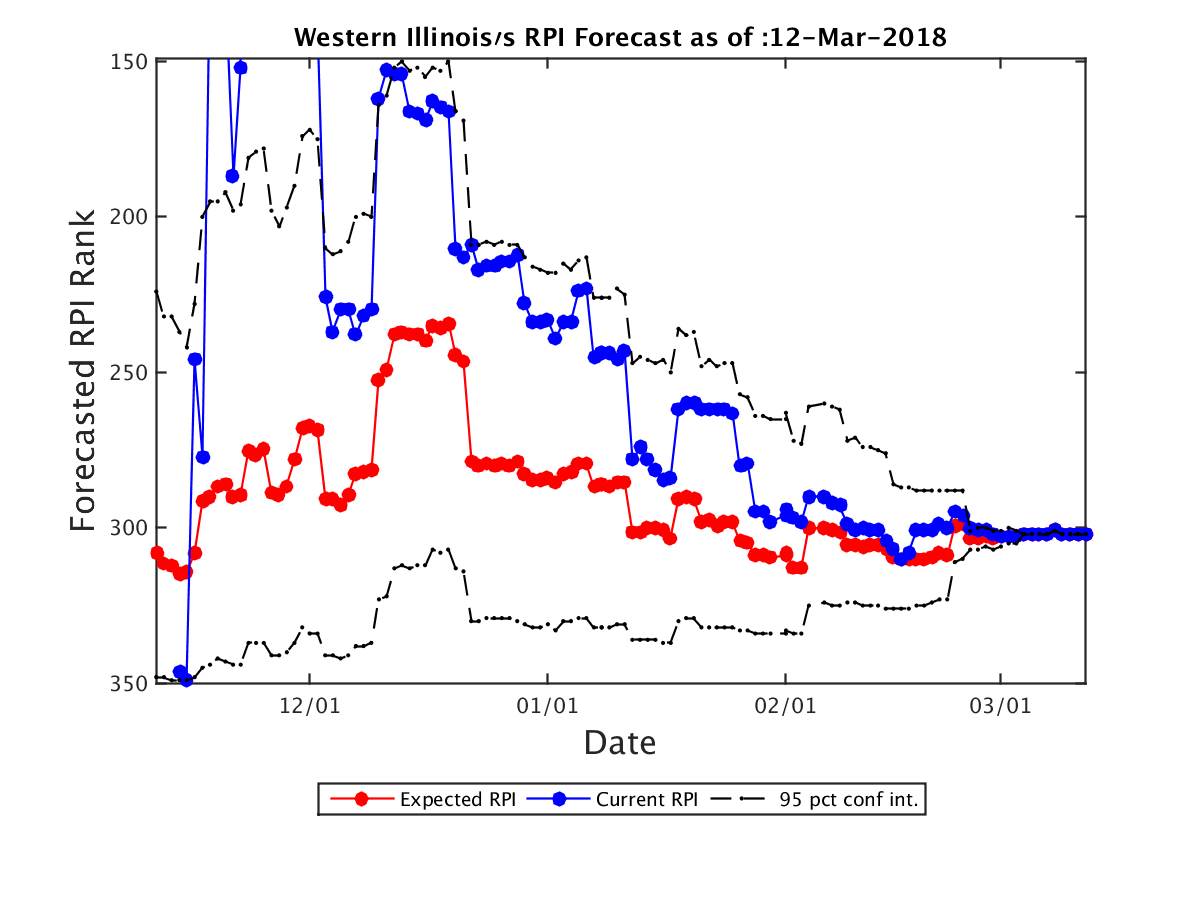
| Expected RPI: | 302.0 |
| Current RPI: | 302 |
| Expected SOS: | 269 |
| Current SOS: | 269 |
| Current Record: | 8-16 |
| Expected Record: | 8-16 |
| Current Conf Record: | 3-12 |
| Expected Conf Record: | 3-12 |
| Expected Record vs RPI 1-25: | 0-0 |
| Expected Record vs RPI 26-50: | 0-4 |
| Expected Record vs RPI 51-100: | 0-2 |
| Expected Record vs RPI 101-200: | 0-2 |
| Expected Record vs RPI 200+: | 8-8 |
| Current OOC Record: | 5-4 |
| Expected OOC Record: | 5-4 |
| Expected OOC RPI: | 256 |
| Expected OOC SOS: | 338 |
| Final Record | Expected RPI | Probability |
|---|---|---|
| 8-16 | 302.0 | 100.00% |
| Date | Opponent (Expected RPI) | Conf | Location | Score | Outcome | Prob(W) | Spread |
|---|---|---|---|---|---|---|---|
| 11-15 | Eastern Illinois (262.0) | OVC | H | 56-54 | W | 100% | 0.0 |
| 11-22 | SIU Edwardsville (287.0) | OVC | A | 67-69 | W | 100% | 0.0 |
| 11-25 | Iowa St. (144.0) | B12 | A | 70-45 | L | 0% | 0.0 |
| 11-28 | IUPUI (294.0) | Horz | H | 90-77 | W | 100% | 0.0 |
| 12-2 | Miami OH (159.0) | MAC | H | 73-76 | L | 0% | 0.0 |
| 12-6 | American (336.0) | Pat | H | 69-56 | W | 100% | 0.0 |
| 12-9 | Milwaukee (231.0) | Horz | H | 90-69 | W | 100% | 0.0 |
| 12-19 | Eastern Illinois (262.0) | OVC | A | 78-77 | L | 0% | 0.0 |
| 12-21 | Butler (41.0) | BE | A | 107-46 | L | 0% | 0.0 |
| 1-3 | South Dakota (91.0) | Sum | A | 62-50 | L | 0% | 0.0 |
| 1-6 | Oral Roberts (255.0) | Sum | A | 81-66 | L | 0% | 0.0 |
| 1-11 | Nebraska Omaha (284.0) | Sum | H | 66-87 | L | 0% | 0.0 |
| 1-17 | Fort Wayne (209.0) | Sum | H | 75-74 | W | 100% | 0.0 |
| 1-20 | South Dakota St. (37.0) | Sum | H | 70-98 | L | 0% | 0.0 |
| 1-25 | Denver (224.0) | Sum | A | 70-58 | L | 0% | 0.0 |
| 1-27 | North Dakota St. (210.0) | Sum | A | 80-69 | L | 0% | 0.0 |
| 2-1 | South Dakota (91.0) | Sum | H | 54-80 | L | 0% | 0.0 |
| 2-3 | Oral Roberts (255.0) | Sum | H | 82-56 | W | 100% | 0.0 |
| 2-8 | Nebraska Omaha (284.0) | Sum | A | 71-68 | L | 0% | 0.0 |
| 2-14 | Fort Wayne (209.0) | Sum | A | 90-74 | L | 0% | 0.0 |
| 2-17 | South Dakota St. (37.0) | Sum | A | 82-62 | L | 0% | 0.0 |
| 2-22 | North Dakota St. (210.0) | Sum | H | 82-74 | W | 100% | 0.0 |
| 2-24 | Denver (224.0) | Sum | H | 52-89 | L | 0% | 0.0 |
| 3-3 | South Dakota St. (37.0) | Sum | N | 66-60 | L | 0% | 0.0 |
| Team | Conf | Curr Wgt | Fut Wgt | Curr W/L | Exp W/L | Curr Impact | Exp Impact |
|---|---|---|---|---|---|---|---|
| Western Illinois | Sum | 26.57 | 26.57 | 28.57 | 28.57 | -11.39 | -11.39 |
| South Dakota St. | Sum | 7.26 | 7.26 | 77.78 | 77.78 | 4.04 | 4.04 |
| South Dakota | Sum | 5.36 | 5.36 | 71.43 | 71.43 | 2.30 | 2.30 |
| North Dakota St. | Sum | 5.28 | 5.28 | 40.74 | 40.74 | -0.98 | -0.98 |
| Denver | Sum | 5.24 | 5.24 | 42.31 | 42.31 | -0.81 | -0.81 |
| Fort Wayne | Sum | 5.24 | 5.24 | 50.00 | 50.00 | 0.00 | 0.00 |
| Nebraska Omaha | Sum | 5.17 | 5.17 | 18.52 | 18.52 | -3.26 | -3.26 |
| Oral Roberts | Sum | 5.17 | 5.17 | 26.92 | 26.92 | -2.39 | -2.39 |
| Eastern Illinois | OVC | 4.27 | 4.27 | 33.33 | 33.33 | -1.42 | -1.42 |
| SIU Edwardsville | OVC | 2.34 | 2.34 | 31.03 | 31.03 | -0.89 | -0.89 |
| IUPUI | Horz | 2.26 | 2.26 | 33.33 | 33.33 | -0.75 | -0.75 |
| Milwaukee | Horz | 2.19 | 2.19 | 50.00 | 50.00 | 0.00 | 0.00 |
| Miami OH | MAC | 2.16 | 2.16 | 43.33 | 43.33 | -0.29 | -0.29 |
| Iowa St. | B12 | 2.12 | 2.12 | 40.00 | 40.00 | -0.42 | -0.42 |
| American | Pat | 2.08 | 2.08 | 20.69 | 20.69 | -1.22 | -1.22 |
| Butler | BE | 2.08 | 2.08 | 59.38 | 59.38 | 0.39 | 0.39 |
| Oakland | Horz | 0.33 | 0.33 | 57.58 | 57.58 | 0.05 | 0.05 |
| Missouri St. | MVC | 0.32 | 0.32 | 53.12 | 53.12 | 0.02 | 0.02 |
| Austin Peay | OVC | 0.32 | 0.32 | 53.33 | 53.33 | 0.02 | 0.02 |
| Drake | MVC | 0.32 | 0.32 | 48.39 | 48.39 | -0.01 | -0.01 |
| Tennessee St. | OVC | 0.28 | 0.28 | 46.43 | 46.43 | -0.02 | -0.02 |
| Montana St. | BSky | 0.25 | 0.25 | 36.67 | 36.67 | -0.07 | -0.07 |
| Illinois Chicago | Horz | 0.25 | 0.25 | 50.00 | 50.00 | 0.00 | 0.00 |
| North Dakota | BSky | 0.25 | 0.25 | 33.33 | 33.33 | -0.08 | -0.08 |
| Belmont | OVC | 0.25 | 0.25 | 72.73 | 72.73 | 0.11 | 0.11 |
| Kansas | B12 | 0.24 | 0.24 | 79.41 | 79.41 | 0.14 | 0.14 |
| Youngstown St. | Horz | 0.24 | 0.24 | 20.00 | 20.00 | -0.15 | -0.15 |
| Detroit | Horz | 0.22 | 0.22 | 20.00 | 20.00 | -0.13 | -0.13 |
| Green Bay | Horz | 0.21 | 0.21 | 33.33 | 33.33 | -0.07 | -0.07 |
| Murray St. | OVC | 0.21 | 0.21 | 82.76 | 82.76 | 0.14 | 0.14 |
| Southeast Missouri St. | OVC | 0.21 | 0.21 | 41.38 | 41.38 | -0.04 | -0.04 |
| Tennessee Martin | OVC | 0.21 | 0.21 | 27.59 | 27.59 | -0.10 | -0.10 |
| Tennessee Tech | OVC | 0.21 | 0.21 | 54.84 | 54.84 | 0.02 | 0.02 |
| Wright St. | Horz | 0.21 | 0.21 | 71.88 | 71.88 | 0.09 | 0.09 |
| TCU | B12 | 0.21 | 0.21 | 65.62 | 65.62 | 0.07 | 0.07 |
| Stetson | ASun | 0.18 | 0.18 | 28.57 | 28.57 | -0.08 | -0.08 |
| Colorado | P12 | 0.18 | 0.18 | 53.12 | 53.12 | 0.01 | 0.01 |
| UC Irvine | BW | 0.18 | 0.18 | 48.48 | 48.48 | -0.01 | -0.01 |
| Wyoming | MWC | 0.18 | 0.18 | 59.38 | 59.38 | 0.03 | 0.03 |
| Kansas St. | B12 | 0.18 | 0.18 | 66.67 | 66.67 | 0.06 | 0.06 |
| Morehead St. | OVC | 0.18 | 0.18 | 22.22 | 22.22 | -0.10 | -0.10 |
| UMKC | WAC | 0.17 | 0.17 | 27.59 | 27.59 | -0.08 | -0.08 |
| Buffalo | MAC | 0.17 | 0.17 | 75.76 | 75.76 | 0.09 | 0.09 |
| Marquette | BE | 0.17 | 0.17 | 59.38 | 59.38 | 0.03 | 0.03 |
| Florida Gulf Coast | ASun | 0.15 | 0.15 | 64.52 | 64.52 | 0.04 | 0.04 |
| Navy | Pat | 0.14 | 0.14 | 61.29 | 61.29 | 0.03 | 0.03 |
| Northern Colorado | BSky | 0.14 | 0.14 | 61.29 | 61.29 | 0.03 | 0.03 |
| San Jose St. | MWC | 0.14 | 0.14 | 10.34 | 10.34 | -0.11 | -0.11 |
| UC Santa Barbara | BW | 0.14 | 0.14 | 70.00 | 70.00 | 0.06 | 0.06 |
| Akron | MAC | 0.14 | 0.14 | 41.94 | 41.94 | -0.02 | -0.02 |
| Cleveland St. | Horz | 0.14 | 0.14 | 32.35 | 32.35 | -0.05 | -0.05 |
| Northern Kentucky | Horz | 0.14 | 0.14 | 68.97 | 68.97 | 0.05 | 0.05 |
| Oklahoma St. | B12 | 0.14 | 0.14 | 57.58 | 57.58 | 0.02 | 0.02 |
| Oklahoma | B12 | 0.14 | 0.14 | 58.06 | 58.06 | 0.02 | 0.02 |
| Iowa | B10 | 0.14 | 0.14 | 42.42 | 42.42 | -0.02 | -0.02 |
| Bowling Green | MAC | 0.14 | 0.14 | 46.67 | 46.67 | -0.01 | -0.01 |
| Texas | B12 | 0.13 | 0.13 | 57.58 | 57.58 | 0.02 | 0.02 |
| Bradley | MVC | 0.11 | 0.11 | 59.38 | 59.38 | 0.02 | 0.02 |
| Tulsa | Amer | 0.11 | 0.11 | 61.29 | 61.29 | 0.02 | 0.02 |
| Eastern Kentucky | OVC | 0.11 | 0.11 | 31.03 | 31.03 | -0.04 | -0.04 |
| Jacksonville St. | OVC | 0.11 | 0.11 | 62.50 | 62.50 | 0.03 | 0.03 |
| South Alabama | SB | 0.11 | 0.11 | 40.00 | 40.00 | -0.02 | -0.02 |
| Alabama St. | SWAC | 0.10 | 0.10 | 25.81 | 25.81 | -0.05 | -0.05 |
| Lafayette | Pat | 0.10 | 0.10 | 30.00 | 30.00 | -0.04 | -0.04 |
| Mississippi | SEC | 0.10 | 0.10 | 37.50 | 37.50 | -0.03 | -0.03 |
| Wichita St. | Amer | 0.10 | 0.10 | 78.12 | 78.12 | 0.06 | 0.06 |
| Purdue | B10 | 0.10 | 0.10 | 82.35 | 82.35 | 0.07 | 0.07 |
| West Virginia | B12 | 0.10 | 0.10 | 70.59 | 70.59 | 0.04 | 0.04 |
| Northern Illinois | MAC | 0.10 | 0.10 | 36.67 | 36.67 | -0.03 | -0.03 |
| Ohio | MAC | 0.10 | 0.10 | 43.33 | 43.33 | -0.01 | -0.01 |
| Western Michigan | MAC | 0.10 | 0.10 | 50.00 | 50.00 | 0.00 | 0.00 |
| Creighton | BE | 0.10 | 0.10 | 64.52 | 64.52 | 0.03 | 0.03 |
| DePaul | BE | 0.10 | 0.10 | 35.48 | 35.48 | -0.03 | -0.03 |
| Seton Hall | BE | 0.09 | 0.09 | 65.62 | 65.62 | 0.03 | 0.03 |
| Villanova | BE | 0.09 | 0.09 | 88.24 | 88.24 | 0.07 | 0.07 |
| Air Force | MWC | 0.07 | 0.07 | 34.48 | 34.48 | -0.02 | -0.02 |
| Arkansas | SEC | 0.07 | 0.07 | 67.65 | 67.65 | 0.03 | 0.03 |
| Delaware St. | MEAC | 0.07 | 0.07 | 6.67 | 6.67 | -0.06 | -0.06 |
| East Tennessee St. | SC | 0.07 | 0.07 | 71.88 | 71.88 | 0.03 | 0.03 |
| Indiana | B10 | 0.07 | 0.07 | 51.61 | 51.61 | 0.00 | 0.00 |
| Kentucky | SEC | 0.07 | 0.07 | 70.59 | 70.59 | 0.03 | 0.03 |
| Liberty | BSth | 0.07 | 0.07 | 54.84 | 54.84 | 0.01 | 0.01 |
| Little Rock | SB | 0.07 | 0.07 | 20.00 | 20.00 | -0.04 | -0.04 |
| Louisiana Tech | CUSA | 0.07 | 0.07 | 48.39 | 48.39 | -0.00 | -0.00 |
| Minnesota | B10 | 0.07 | 0.07 | 46.88 | 46.88 | -0.00 | -0.00 |
| Montana | BSky | 0.07 | 0.07 | 77.42 | 77.42 | 0.04 | 0.04 |
| Penn St. | B10 | 0.07 | 0.07 | 61.76 | 61.76 | 0.02 | 0.02 |
| Pepperdine | WCC | 0.07 | 0.07 | 16.13 | 16.13 | -0.05 | -0.05 |
| St. Francis NY | NEC | 0.07 | 0.07 | 37.93 | 37.93 | -0.02 | -0.02 |
| Stanford | P12 | 0.07 | 0.07 | 54.55 | 54.55 | 0.01 | 0.01 |
| UNLV | MWC | 0.07 | 0.07 | 60.61 | 60.61 | 0.02 | 0.02 |
| USC Upstate | ASun | 0.07 | 0.07 | 10.71 | 10.71 | -0.06 | -0.06 |
| Arizona | P12 | 0.07 | 0.07 | 79.41 | 79.41 | 0.04 | 0.04 |
| Arkansas St. | SB | 0.07 | 0.07 | 30.00 | 30.00 | -0.03 | -0.03 |
| Florida A&M | MEAC | 0.07 | 0.07 | 24.24 | 24.24 | -0.04 | -0.04 |
| Jackson St. | SWAC | 0.07 | 0.07 | 33.33 | 33.33 | -0.02 | -0.02 |
| Louisville | ACC | 0.07 | 0.07 | 60.61 | 60.61 | 0.02 | 0.02 |
| Mississippi St. | SEC | 0.07 | 0.07 | 65.62 | 65.62 | 0.02 | 0.02 |
| Nebraska | B10 | 0.07 | 0.07 | 68.75 | 68.75 | 0.03 | 0.03 |
| New Mexico | MWC | 0.07 | 0.07 | 54.55 | 54.55 | 0.01 | 0.01 |
| San Diego St. | MWC | 0.07 | 0.07 | 67.74 | 67.74 | 0.03 | 0.03 |
| Stephen F. Austin | Slnd | 0.07 | 0.07 | 80.00 | 80.00 | 0.04 | 0.04 |
| UNC Wilmington | CAA | 0.07 | 0.07 | 30.00 | 30.00 | -0.03 | -0.03 |
| USC | P12 | 0.07 | 0.07 | 67.65 | 67.65 | 0.03 | 0.03 |
| UTEP | CUSA | 0.07 | 0.07 | 33.33 | 33.33 | -0.02 | -0.02 |
| Washington | P12 | 0.07 | 0.07 | 62.50 | 62.50 | 0.02 | 0.02 |
| Ball St. | MAC | 0.07 | 0.07 | 58.06 | 58.06 | 0.01 | 0.01 |
| Army | Pat | 0.07 | 0.07 | 41.38 | 41.38 | -0.01 | -0.01 |
| Boston University | Pat | 0.07 | 0.07 | 46.67 | 46.67 | -0.00 | -0.00 |
| Bucknell | Pat | 0.07 | 0.07 | 73.53 | 73.53 | 0.03 | 0.03 |
| Colgate | Pat | 0.07 | 0.07 | 58.06 | 58.06 | 0.01 | 0.01 |
| Duke | ACC | 0.07 | 0.07 | 78.79 | 78.79 | 0.04 | 0.04 |
| Eastern Washington | BSky | 0.07 | 0.07 | 56.25 | 56.25 | 0.01 | 0.01 |
| Grambling St. | SWAC | 0.07 | 0.07 | 53.33 | 53.33 | 0.00 | 0.00 |
| Holy Cross | Pat | 0.07 | 0.07 | 38.71 | 38.71 | -0.02 | -0.02 |
| Lehigh | Pat | 0.07 | 0.07 | 51.72 | 51.72 | 0.00 | 0.00 |
| Loyola MD | Pat | 0.07 | 0.07 | 26.67 | 26.67 | -0.03 | -0.03 |
| Northern Arizona | BSky | 0.07 | 0.07 | 13.33 | 13.33 | -0.05 | -0.05 |
| Southern Miss | CUSA | 0.07 | 0.07 | 40.00 | 40.00 | -0.01 | -0.01 |
| UCLA | P12 | 0.07 | 0.07 | 65.62 | 65.62 | 0.02 | 0.02 |
| Central Michigan | MAC | 0.07 | 0.07 | 53.33 | 53.33 | 0.00 | 0.00 |
| Maryland Eastern Shore | MEAC | 0.07 | 0.07 | 16.67 | 16.67 | -0.05 | -0.05 |
| Baylor | B12 | 0.07 | 0.07 | 54.84 | 54.84 | 0.01 | 0.01 |
| Eastern Michigan | MAC | 0.07 | 0.07 | 58.62 | 58.62 | 0.01 | 0.01 |
| Kent St. | MAC | 0.07 | 0.07 | 48.48 | 48.48 | -0.00 | -0.00 |
| Missouri | SEC | 0.07 | 0.07 | 61.29 | 61.29 | 0.02 | 0.02 |
| Texas Tech | B12 | 0.07 | 0.07 | 72.73 | 72.73 | 0.03 | 0.03 |
| Toledo | MAC | 0.07 | 0.07 | 66.67 | 66.67 | 0.02 | 0.02 |
| Ohio St. | B10 | 0.07 | 0.07 | 75.00 | 75.00 | 0.03 | 0.03 |
| Georgetown | BE | 0.06 | 0.06 | 50.00 | 50.00 | 0.00 | 0.00 |
| Providence | BE | 0.06 | 0.06 | 61.76 | 61.76 | 0.01 | 0.01 |
| St. John's | BE | 0.06 | 0.06 | 46.88 | 46.88 | -0.00 | -0.00 |
| Xavier | BE | 0.06 | 0.06 | 84.85 | 84.85 | 0.04 | 0.04 |
| Gonzaga | WCC | 0.04 | 0.04 | 88.24 | 88.24 | 0.03 | 0.03 |
| Washington St. | P12 | 0.04 | 0.04 | 38.71 | 38.71 | -0.01 | -0.01 |
| Chicago St. | WAC | 0.03 | 0.03 | 3.33 | 3.33 | -0.03 | -0.03 |
| Howard | MEAC | 0.03 | 0.03 | 25.81 | 25.81 | -0.02 | -0.02 |
| Mount St. Mary's | NEC | 0.03 | 0.03 | 53.33 | 53.33 | 0.00 | 0.00 |
| New Hampshire | AE | 0.03 | 0.03 | 27.59 | 27.59 | -0.02 | -0.02 |
| Southern Illinois | MVC | 0.03 | 0.03 | 59.38 | 59.38 | 0.01 | 0.01 |
| St. Francis PA | NEC | 0.03 | 0.03 | 57.14 | 57.14 | 0.00 | 0.00 |
| Valparaiso | MVC | 0.03 | 0.03 | 43.33 | 43.33 | -0.00 | -0.00 |
| VMI | SC | 0.03 | 0.03 | 25.00 | 25.00 | -0.02 | -0.02 |
| Wagner | NEC | 0.03 | 0.03 | 70.00 | 70.00 | 0.01 | 0.01 |
| Alcorn St. | SWAC | 0.03 | 0.03 | 25.00 | 25.00 | -0.02 | -0.02 |
| Appalachian St. | SB | 0.03 | 0.03 | 41.94 | 41.94 | -0.01 | -0.01 |
| Boise St. | MWC | 0.03 | 0.03 | 73.33 | 73.33 | 0.02 | 0.02 |
| Elon | CAA | 0.03 | 0.03 | 40.00 | 40.00 | -0.01 | -0.01 |
| FIU | CUSA | 0.03 | 0.03 | 37.93 | 37.93 | -0.01 | -0.01 |
| Fordham | A10 | 0.03 | 0.03 | 29.03 | 29.03 | -0.01 | -0.01 |
| Hartford | AE | 0.03 | 0.03 | 58.06 | 58.06 | 0.01 | 0.01 |
| Jacksonville | ASun | 0.03 | 0.03 | 37.93 | 37.93 | -0.01 | -0.01 |
| LIU Brooklyn | NEC | 0.03 | 0.03 | 51.52 | 51.52 | 0.00 | 0.00 |
| Loyola Chicago | MVC | 0.03 | 0.03 | 84.38 | 84.38 | 0.02 | 0.02 |
| Northern Iowa | MVC | 0.03 | 0.03 | 46.67 | 46.67 | -0.00 | -0.00 |
| Tennessee | SEC | 0.03 | 0.03 | 75.76 | 75.76 | 0.02 | 0.02 |
| Tulane | Amer | 0.03 | 0.03 | 45.16 | 45.16 | -0.00 | -0.00 |
| Wisconsin | B10 | 0.03 | 0.03 | 45.45 | 45.45 | -0.00 | -0.00 |
| Furman | SC | 0.03 | 0.03 | 67.74 | 67.74 | 0.01 | 0.01 |
| Kennesaw St. | ASun | 0.03 | 0.03 | 28.57 | 28.57 | -0.01 | -0.01 |
| Maryland | B10 | 0.03 | 0.03 | 58.06 | 58.06 | 0.01 | 0.01 |
| Portland St. | BSky | 0.03 | 0.03 | 56.67 | 56.67 | 0.00 | 0.00 |
| Princeton | Ivy | 0.03 | 0.03 | 42.86 | 42.86 | -0.00 | -0.00 |
| Saint Louis | A10 | 0.03 | 0.03 | 50.00 | 50.00 | 0.00 | 0.00 |
| Utah | P12 | 0.03 | 0.03 | 63.33 | 63.33 | 0.01 | 0.01 |